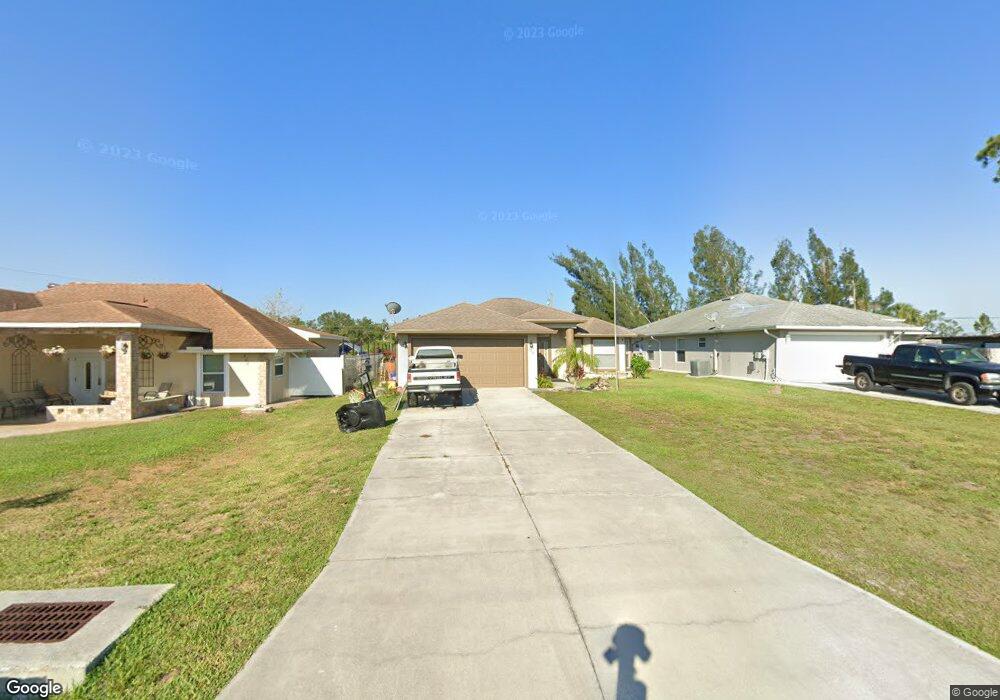
408 Isabel St North Port, FL 34287
Warm Mineral Springs NeighborhoodEstimated Value: $255,000 - $310,000
3
Beds
4
Baths
2,180
Sq Ft
$133/Sq Ft
Est. Value
About This Home
This home is located at 408 Isabel St, North Port, FL 34287 and is currently estimated at $290,856, approximately $133 per square foot. 408 Isabel St is a home located in Sarasota County with nearby schools including Glenallen Elementary School, North Port High School, and Heron Creek Middle School.
Ownership History
Date
Name
Owned For
Owner Type
Purchase Details
Closed on
Jul 16, 2021
Sold by
Bobrov Boris and Bobrov Mark
Bought by
Owens Thurman A and Owens Jennie L
Current Estimated Value
Home Financials for this Owner
Home Financials are based on the most recent Mortgage that was taken out on this home.
Original Mortgage
$203,741
Outstanding Balance
$184,863
Interest Rate
2.9%
Mortgage Type
FHA
Estimated Equity
$105,993
Purchase Details
Closed on
Jun 7, 2019
Sold by
Bobrov Boris
Bought by
Bobrov Boris and Bobrov Mark
Purchase Details
Closed on
Feb 4, 2018
Sold by
Bobrov Boris
Bought by
Bobrov Mark
Purchase Details
Closed on
Nov 30, 2011
Sold by
Bobrov Boris and Bobrov Galina
Bought by
Bobrov Boris
Purchase Details
Closed on
Mar 17, 2005
Sold by
Carboni Monica and Kapica Eugene
Bought by
Bobrov Boris and Bobrov Galina
Purchase Details
Closed on
Mar 14, 2005
Sold by
Sawalt Manfred
Bought by
Carboni Monica and Kapica Gene
Purchase Details
Closed on
Jun 3, 1998
Sold by
Sawalt Manfred
Bought by
Carboni Monica and Kapica Gene
Create a Home Valuation Report for This Property
The Home Valuation Report is an in-depth analysis detailing your home's value as well as a comparison with similar homes in the area
Home Values in the Area
Average Home Value in this Area
Purchase History
| Date | Buyer | Sale Price | Title Company |
|---|---|---|---|
| Owens Thurman A | $207,500 | Attorney | |
| Bobrov Boris | -- | Attorney | |
| Bobrov Mark | -- | Attorney | |
| Bobrov Boris | -- | None Available | |
| Bobrov Boris | $240,000 | Chelsea Title Company | |
| Carboni Monica | -- | Chelsea Title Company | |
| Carboni Monica | $2,000 | -- |
Source: Public Records
Mortgage History
| Date | Status | Borrower | Loan Amount |
|---|---|---|---|
| Open | Owens Thurman A | $203,741 |
Source: Public Records
Tax History Compared to Growth
Tax History
| Year | Tax Paid | Tax Assessment Tax Assessment Total Assessment is a certain percentage of the fair market value that is determined by local assessors to be the total taxable value of land and additions on the property. | Land | Improvement |
|---|---|---|---|---|
| 2024 | $3,495 | $257,800 | $23,500 | $234,300 |
| 2023 | $3,495 | $286,900 | $25,000 | $261,900 |
| 2022 | $3,646 | $263,900 | $22,000 | $241,900 |
| 2021 | $2,696 | $184,600 | $9,400 | $175,200 |
| 2020 | $2,410 | $152,900 | $8,600 | $144,300 |
| 2019 | $2,419 | $164,100 | $9,600 | $154,500 |
| 2018 | $2,222 | $149,500 | $12,500 | $137,000 |
| 2017 | $2,203 | $130,922 | $0 | $0 |
| 2016 | $2,031 | $141,600 | $9,300 | $132,300 |
| 2015 | $1,761 | $108,200 | $8,700 | $99,500 |
| 2014 | $1,816 | $99,200 | $0 | $0 |
Source: Public Records
Map
Nearby Homes
- 0 Roberta St Unit MFRD6140550
- Lot #13 Roberta St
- Lot #11 Roberta St
- LOTS 26 AND 1/2OF LO Granada Lots 25 & 26and 1 2of Lot 24 Par#2 Dr
- LOTS 25 AND 1/2 0F L Granada Dr Lots 25 & 26 and 1 2 0f Lot 24 Parcel1 Dr
- Lot 8 Dolores St
- Lot 6 Dolores St
- LOT 13 Barcelona St
- LOT 11 Barcelona St
- Lot 8 Ventura St
- Lot 7 Ventura St
- 431 Sevilla St
- LOT 39 Majorca Place
- LOT 47 Majorca Place
- LOT 51 Majorca Place
- LOT 52 Majorca Place
- LOT#27 San Marco Ave
- Lot #1 Capilla Ln
- 0 San Marino Ave Unit 5 MFRC7514228
- 0 San Marino Ave Unit MFRA4651479
- 406 Isabel St
- 410 Isabel St
- 412 Isabel St
- 400 Isabel St
- 0 Isabel St
- 409 Isabel St
- 0 Perdido St Unit MFRA4581346
- 0 Perdido St Unit MFRA4580900
- Perdido St
- 0 Perdido St Unit N6119943
- 0 Perdido St Unit N6119589
- 0 Perdido St Unit N6118585
- 0 Perdido St Unit C7440906
- Perdido St
- 0 Perdido St Unit N6111395
- 0 Perdido St Unit N6111358
- 0 Perdido St Unit A4455514
- 0 Perdido St Unit N6103465
- 12075 Granada Dr
- 401 Isabel St