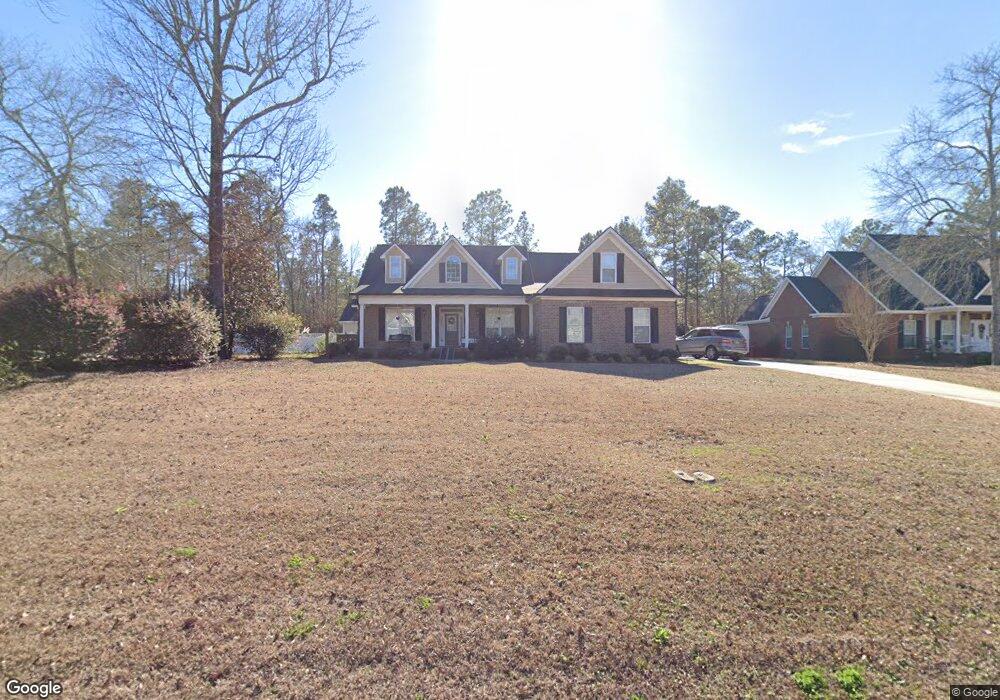
408 Myrtle Crossing Ln Statesboro, GA 30458
Estimated Value: $423,000 - $465,000
4
Beds
3
Baths
2,451
Sq Ft
$181/Sq Ft
Est. Value
About This Home
This home is located at 408 Myrtle Crossing Ln, Statesboro, GA 30458 and is currently estimated at $442,461, approximately $180 per square foot. 408 Myrtle Crossing Ln is a home located in Bulloch County with nearby schools including Mattie Lively Elementary School, Statesboro High School, and William James Middle School.
Ownership History
Date
Name
Owned For
Owner Type
Purchase Details
Closed on
May 5, 2021
Sold by
Padgett John David
Bought by
Tatsuko Christopher M and Tatsuko April
Current Estimated Value
Purchase Details
Closed on
Oct 24, 2012
Sold by
Padgett David
Bought by
Hunter Carl T and Hunter Faye K
Purchase Details
Closed on
May 28, 2008
Sold by
Not Provided
Bought by
Padgett John David and Padgett Buffie C
Home Financials for this Owner
Home Financials are based on the most recent Mortgage that was taken out on this home.
Original Mortgage
$258,000
Interest Rate
6.02%
Mortgage Type
New Conventional
Purchase Details
Closed on
May 3, 2007
Sold by
Not Provided
Bought by
Padgett John David and Padgett Buffie C
Purchase Details
Closed on
Jul 6, 2006
Sold by
Not Provided
Bought by
Padgett David
Purchase Details
Closed on
May 5, 2005
Sold by
Myrtle Crossing Llc
Bought by
Sav Investments Llc
Create a Home Valuation Report for This Property
The Home Valuation Report is an in-depth analysis detailing your home's value as well as a comparison with similar homes in the area
Home Values in the Area
Average Home Value in this Area
Purchase History
| Date | Buyer | Sale Price | Title Company |
|---|---|---|---|
| Tatsuko Christopher M | $305,000 | -- | |
| Hunter Carl T | $20,000 | -- | |
| Padgett John David | -- | -- | |
| Padgett John David | -- | -- | |
| Padgett David | $77,000 | -- | |
| Sav Investments Llc | $38,500 | -- |
Source: Public Records
Mortgage History
| Date | Status | Borrower | Loan Amount |
|---|---|---|---|
| Previous Owner | Padgett John David | $258,000 |
Source: Public Records
Tax History Compared to Growth
Tax History
| Year | Tax Paid | Tax Assessment Tax Assessment Total Assessment is a certain percentage of the fair market value that is determined by local assessors to be the total taxable value of land and additions on the property. | Land | Improvement |
|---|---|---|---|---|
| 2024 | $4,200 | $155,240 | $20,000 | $135,240 |
| 2023 | $2,812 | $151,840 | $10,000 | $141,840 |
| 2022 | $2,354 | $125,221 | $8,000 | $117,221 |
| 2021 | $2,247 | $111,403 | $8,000 | $103,403 |
| 2020 | $2,225 | $107,203 | $8,000 | $99,203 |
| 2019 | $2,244 | $107,513 | $8,000 | $99,513 |
| 2018 | $2,217 | $101,832 | $8,000 | $93,832 |
| 2017 | $2,280 | $103,517 | $8,000 | $95,517 |
| 2016 | $2,363 | $104,607 | $12,000 | $92,607 |
| 2015 | $2,327 | $102,550 | $12,000 | $90,550 |
| 2014 | $1,962 | $102,550 | $12,000 | $90,550 |
Source: Public Records
Map
Nearby Homes
- 448 Myrtle Crossing Ln
- 208 Nesmith Way
- 437 Myrtle Crossing Ln
- 103 Oak Hollow Dr
- 29 Jef Rd
- 197 Zetterower Rd
- 111 Zetterower Rd
- 0 Miller Street Extension Unit 10595930
- 0 Miller Street Extension Unit LOT 18 10595926
- 0 Miller Street Extension Unit LOT 19 10595919
- 0 Miller Street Extension Unit LOT 20 10595908
- 0 Miller Street Extension Unit LOT 21 10595866
- 0 Miller Street Extension Unit LOT 22 10595860
- 0 Miller Street Extension Unit LOT 23 10594167
- 3 Friar Tuck Trail
- 113 Ladd Cir
- 141 Williams Rd
- 124 Pin Oak Ln
- 328 N Main St
- 318 N Main St
- 406 Myrtle Crossing Ln
- 406 Myrtle Crossing Ln
- 406 Myrtle Crossing Ln
- 410 Myrtle Crossing Ln
- 407 Myrtle Crossing Ln
- 405 Myrtle Crossing Ln
- 412 Myrtle Crossing Ln
- 404 Myrtle Crossing
- 404 Myrtle Crossing Ln
- 409 Myrtle Crossing Ln
- 403 Myrtle Crossing Ln
- 337 Myrtle Crossing Dr
- 414 Myrtle Crossing Ln
- 411 Myrtle Crossing Ln
- 335 Myrtle Crossing Dr
- 455 Myrtle Crossing
- 455 Myrtle Crossing Ln
- 455 Myrtle Crossing Ln Unit 15
- 453 Myrtle Crossing Ln
- 451 Myrtle Crossing Ln