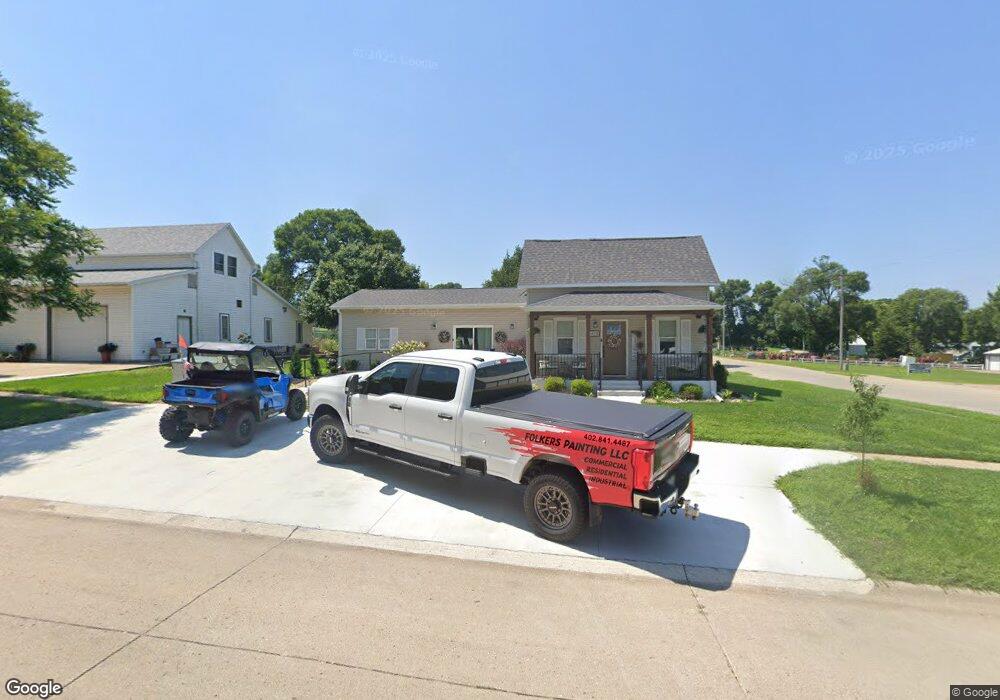
408 N Cedar Ave Hartington, NE 68739
Estimated Value: $127,000 - $171,000
--
Bed
--
Bath
1,767
Sq Ft
$82/Sq Ft
Est. Value
About This Home
This home is located at 408 N Cedar Ave, Hartington, NE 68739 and is currently estimated at $145,446, approximately $82 per square foot. 408 N Cedar Ave is a home located in Cedar County with nearby schools including Hartington-Newcastle Elementary School, Hartington-Newcastle High School, and Holy Trinity Elementary School.
Create a Home Valuation Report for This Property
The Home Valuation Report is an in-depth analysis detailing your home's value as well as a comparison with similar homes in the area
Home Values in the Area
Average Home Value in this Area
Purchase History
| Date | Buyer | Sale Price | Title Company |
|---|---|---|---|
| Folkers Travis J | -- | -- |
Source: Public Records
Tax History Compared to Growth
Tax History
| Year | Tax Paid | Tax Assessment Tax Assessment Total Assessment is a certain percentage of the fair market value that is determined by local assessors to be the total taxable value of land and additions on the property. | Land | Improvement |
|---|---|---|---|---|
| 2024 | $1,054 | $91,055 | $13,750 | $77,305 |
| 2023 | $1,191 | $80,040 | $13,750 | $66,290 |
| 2022 | $1,195 | $77,495 | $13,750 | $63,745 |
| 2021 | $1,135 | $74,075 | $12,780 | $61,295 |
| 2020 | $1,125 | $74,075 | $12,780 | $61,295 |
| 2019 | $1,115 | $74,075 | $12,780 | $61,295 |
| 2018 | $1,037 | $71,120 | $12,780 | $58,340 |
| 2017 | $1,008 | $71,120 | $12,780 | $58,340 |
| 2016 | $921 | $71,120 | $12,780 | $58,340 |
| 2015 | $894 | $71,100 | $15,975 | $55,125 |
| 2014 | $462 | $33,400 | $15,975 | $17,425 |
| 2013 | -- | $33,400 | $15,975 | $17,425 |
Source: Public Records
Map
Nearby Homes
- 207 W Main St
- 106 S Cedar Ave
- 305 S Cornel Ave
- 307 E Centre St
- 206 N Aberley Ave
- 503 W Leblanch St
- 507 W Leblanch St
- 504 W Leblanch St
- 403 S Madison Ave
- 616 Neuhalfen Dr
- 613 S Madison Ave
- 88477 Highway 57
- 103 E Ridge View Rd
- 100 E Ridge View Rd
- 409 W Broadway St
- 613 E Broadway St
- 405 S Main St
- 407 S Main St
- 409 S Main St
- 411 S Main St
- 406 N Cedar Ave
- 404 N Cedar Ave
- 405 N Cedar Ave
- 402 N Cedar Ave
- 403 N Cedar Ave
- 306 W Elm St
- 401 N Cedar Ave
- 503 N Robinson Ave
- 503 N Robinson Ave
- 503 N Robinson Ave
- 503 N Robinson Ave
- 406 N Summit Ave
- 306 N Cedar Ave
- 312 W Elm St
- 301 W Elm St
- 404 N Summit Ave
- 307 N Cedar Ave
- 304 N Cedar Ave
- 402 N Summit Ave
- 303 W Elm St