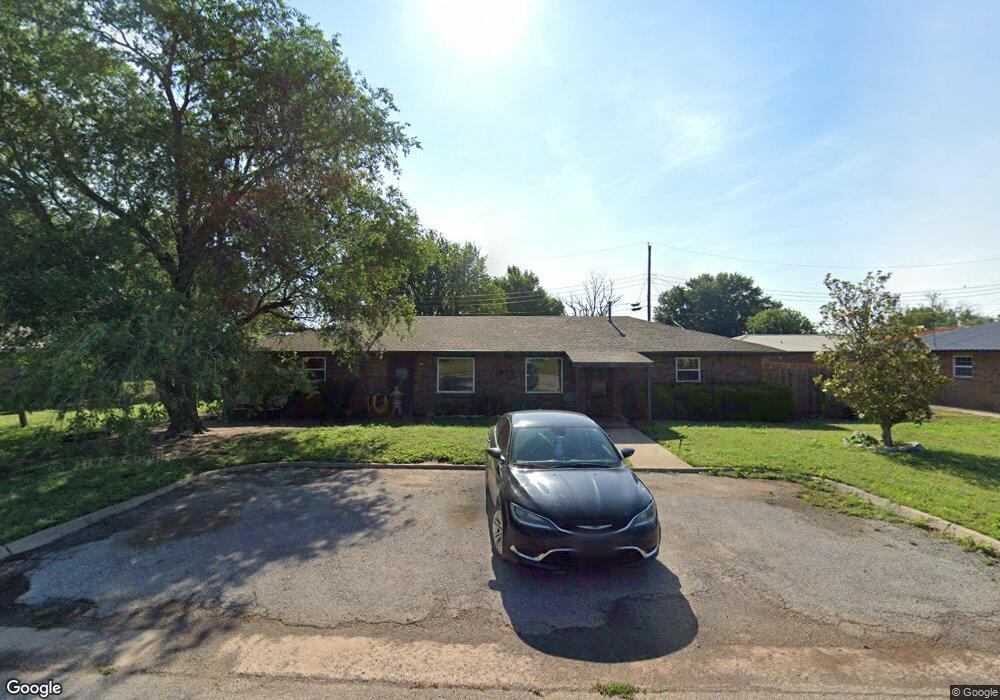
408 N Foraker Ave Watonga, OK 73772
Estimated Value: $132,000 - $142,000
4
Beds
2
Baths
1,612
Sq Ft
$85/Sq Ft
Est. Value
About This Home
This home is located at 408 N Foraker Ave, Watonga, OK 73772 and is currently estimated at $136,521, approximately $84 per square foot. 408 N Foraker Ave is a home with nearby schools including Watonga Elementary School, Watonga Middle School, and Watonga High School.
Ownership History
Date
Name
Owned For
Owner Type
Purchase Details
Closed on
Jul 15, 2013
Sold by
Housing Authority Of The Cheyenne Arapah
Bought by
Smith Tony and Smith Janelle
Current Estimated Value
Purchase Details
Closed on
Sep 20, 2006
Sold by
Stevens Charles L and Stevens Jacquita K
Bought by
Housing Authority Of The Cheyenne Arapah
Purchase Details
Closed on
Sep 21, 2005
Sold by
Stevens Charles L and Stevens Jacquita K
Bought by
Stevens Charles L and Stevens Jacquita K
Purchase Details
Closed on
Sep 14, 2005
Sold by
Deutsche Bank National Trust Co
Bought by
Stevens Charles L
Purchase Details
Closed on
Feb 10, 2005
Sold by
Hartfield Kenneth and Hartfield Elaine
Bought by
Deutsche Bank National Trust Co and Bankers Trust Co California Na
Purchase Details
Closed on
May 23, 2000
Sold by
Moore George R
Bought by
Hartfield Kenneth
Purchase Details
Closed on
Jan 3, 1997
Sold by
Lucas Jr Fred R and Lucas Joyce
Bought by
Moore George R
Create a Home Valuation Report for This Property
The Home Valuation Report is an in-depth analysis detailing your home's value as well as a comparison with similar homes in the area
Home Values in the Area
Average Home Value in this Area
Purchase History
| Date | Buyer | Sale Price | Title Company |
|---|---|---|---|
| Smith Tony | -- | None Available | |
| Housing Authority Of The Cheyenne Arapah | $65,000 | -- | |
| Stevens Charles L | -- | None Available | |
| Stevens Charles L | $18,000 | -- | |
| Stevens Charles L | $18,000 | First Financial Title Agency | |
| Deutsche Bank National Trust Co | -- | -- | |
| Deutsche Bank National Trust Co | $59,279 | None Available | |
| Hartfield Kenneth | $54,700 | -- | |
| Moore George R | $75,000 | -- |
Source: Public Records
Tax History Compared to Growth
Tax History
| Year | Tax Paid | Tax Assessment Tax Assessment Total Assessment is a certain percentage of the fair market value that is determined by local assessors to be the total taxable value of land and additions on the property. | Land | Improvement |
|---|---|---|---|---|
| 2024 | $738 | $8,588 | $533 | $8,055 |
| 2023 | $714 | $8,338 | $533 | $7,805 |
| 2022 | $772 | $8,095 | $533 | $7,562 |
| 2021 | $698 | $8,095 | $533 | $7,562 |
| 2020 | $706 | $8,261 | $533 | $7,728 |
| 2019 | $697 | $8,021 | $533 | $7,488 |
| 2018 | $742 | $8,163 | $852 | $7,311 |
| 2017 | $737 | $7,925 | $196 | $7,729 |
| 2016 | $891 | $8,874 | $196 | $8,678 |
| 2015 | $869 | $8,616 | $196 | $8,420 |
| 2014 | $661 | $8,205 | $196 | $8,009 |
Source: Public Records
Map
Nearby Homes
- 720 W 3rd St
- 321 N Flynn
- 711 Villa Place Unit 181A
- 409 W 3rd St
- 319 N Wikoff Ave
- 401 N Leach Ave
- 834 Mimosa Dr
- 114 N Leach Ave Unit 116 118 & 120 N Leac
- 1221 W Main St
- 100 W 3rd St
- 704 N Prouty Ave
- 815 N Prouty Ave
- 101 E 5th St Unit 103 E 5th St
- 401 Russworm Dr
- 220 Russworm Dr
- 400 S Leach Ave Unit 400 S Prouty
- 121 E Main St
- 1017 N Prouty Ave
- 117 S Noble Ave
- 515 N Burford Ave
- 407 N Marshall Ave
- 412 N Foraker Ave
- 404 N Foraker Ave
- 411 N Marshall Ave
- 403 N Marshall Ave
- 619 Circle Dr
- 621 Circle Dr
- 410 N Marshall Ave
- 416 N Marshall Ave
- 802 W 3rd St
- 618 Circle Dr
- 718 W 3rd St
- 623 Circle Dr
- 321 N Foraker Ave
- 320 N Foraker Ave
- 715 W 3rd St
- 812 W 3rd St
- 321 Flynn Ave
- 625 Circle Dr
- 615 Circle Dr