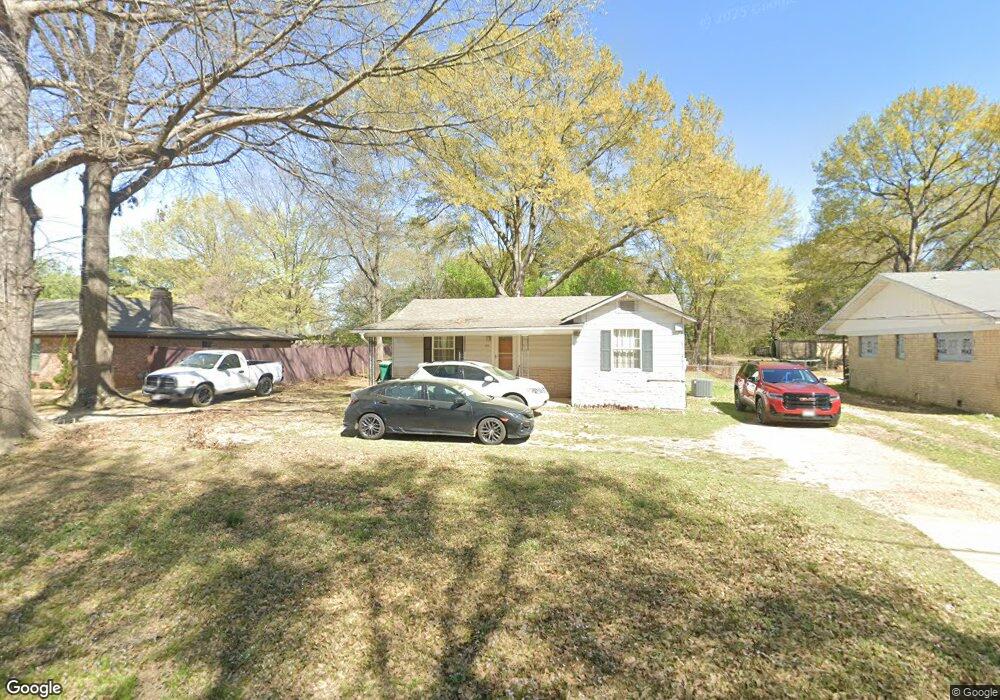
408 N Kenwood Rd Texarkana, TX 75501
Estimated Value: $71,827 - $157,000
2
Beds
1
Bath
813
Sq Ft
$117/Sq Ft
Est. Value
About This Home
This home is located at 408 N Kenwood Rd, Texarkana, TX 75501 and is currently estimated at $94,957, approximately $116 per square foot. 408 N Kenwood Rd is a home located in Bowie County with nearby schools including Westlawn Elementary School, Theron Jones Early Literacy Center, and Texas Middle School.
Ownership History
Date
Name
Owned For
Owner Type
Purchase Details
Closed on
Nov 7, 2016
Sold by
Rocktop Partners I Trust
Bought by
Home Investment Fund Iii Lp
Current Estimated Value
Purchase Details
Closed on
Oct 29, 2014
Sold by
Home Opportunity Llc
Bought by
Rocktop Partners I Lp
Purchase Details
Closed on
Jan 24, 2014
Sold by
Transportation Alliance Bank Inc
Bought by
Home Opportunity Llc
Purchase Details
Closed on
Mar 29, 2013
Sold by
Transportation Alliance Bank Inc
Bought by
Home Opportunity Llc
Purchase Details
Closed on
Aug 21, 2012
Sold by
Gerar Inc
Bought by
Transporation Alliance Bank Inc
Purchase Details
Closed on
May 11, 2011
Sold by
Money Line Mortgage Llc
Bought by
Gerar Inc
Purchase Details
Closed on
Nov 1, 2010
Sold by
Citimortgage Inc
Bought by
Money-Line Mortgage Llc
Create a Home Valuation Report for This Property
The Home Valuation Report is an in-depth analysis detailing your home's value as well as a comparison with similar homes in the area
Home Values in the Area
Average Home Value in this Area
Purchase History
| Date | Buyer | Sale Price | Title Company |
|---|---|---|---|
| Home Investment Fund Iii Lp | -- | Stewart Title | |
| Rocktop Partners I Lp | -- | None Available | |
| Home Opportunity Llc | -- | None Available | |
| Home Opportunity Llc | -- | None Available | |
| Transporation Alliance Bank Inc | -- | None Available | |
| Gerar Inc | -- | None Available | |
| Money-Line Mortgage Llc | -- | None Available |
Source: Public Records
Tax History Compared to Growth
Tax History
| Year | Tax Paid | Tax Assessment Tax Assessment Total Assessment is a certain percentage of the fair market value that is determined by local assessors to be the total taxable value of land and additions on the property. | Land | Improvement |
|---|---|---|---|---|
| 2025 | $391 | $59,087 | -- | -- |
| 2024 | $391 | $53,715 | $11,500 | $43,370 |
| 2023 | $1,156 | $48,832 | $0 | $0 |
| 2022 | $1,060 | $44,393 | $8,500 | $35,893 |
| 2021 | $1,045 | $40,867 | $8,500 | $32,367 |
| 2020 | $1,011 | $39,328 | $8,500 | $30,828 |
| 2019 | $1,010 | $37,863 | $8,500 | $29,363 |
| 2018 | $993 | $37,227 | $8,500 | $28,727 |
| 2017 | $975 | $36,666 | $8,500 | $28,166 |
| 2016 | $1,062 | $39,921 | $13,990 | $25,931 |
| 2015 | $1,001 | $39,669 | $13,990 | $25,679 |
| 2014 | $1,001 | $38,682 | $13,990 | $24,692 |
Source: Public Records
Map
Nearby Homes
- TBD N Kenwood Rd
- 500 Wade Ln
- 0 Belt Rd Unit 118684
- 210 Cheyenne Place
- 322 Brookwood Dr
- 207 Wildwood Dr
- 202 S Kenwood Rd
- 3106 Meadows Dr
- 3303 New Boston Rd
- 2211 N Akin Ave
- 2901 Marion St
- 203 Madison Dr
- 0 Meadowbrook Ln
- TBD U S 59
- 4035 New Boston Rd
- 1703 Liddell St
- hawkins Hawkins
- 1406 Richmond Rd
- 101 Sierra Madre Ln
- 0 Collins Rd Unit 20899332
- 406 N Kenwood Rd
- 412 N Kenwood Rd
- 404 N Kenwood Rd
- 414 N Kenwood Rd
- 415 N Kenwood Rd
- 417 N Kenwood Rd
- 416 N Kenwood Rd
- 715 Boardwalk Ave
- 716 Hillview St
- 711 Boardwalk Ave
- 714 Hillview St
- 501 N Kenwood Rd
- 403 N Kenwood Rd
- 709 Boardwalk Ave
- 712 Hillview St
- 714 Boardwalk Ave
- 502 N Kenwood Rd
- 707 Boardwalk Ave
- 710 Hillview St
- 304 N Kenwood Rd