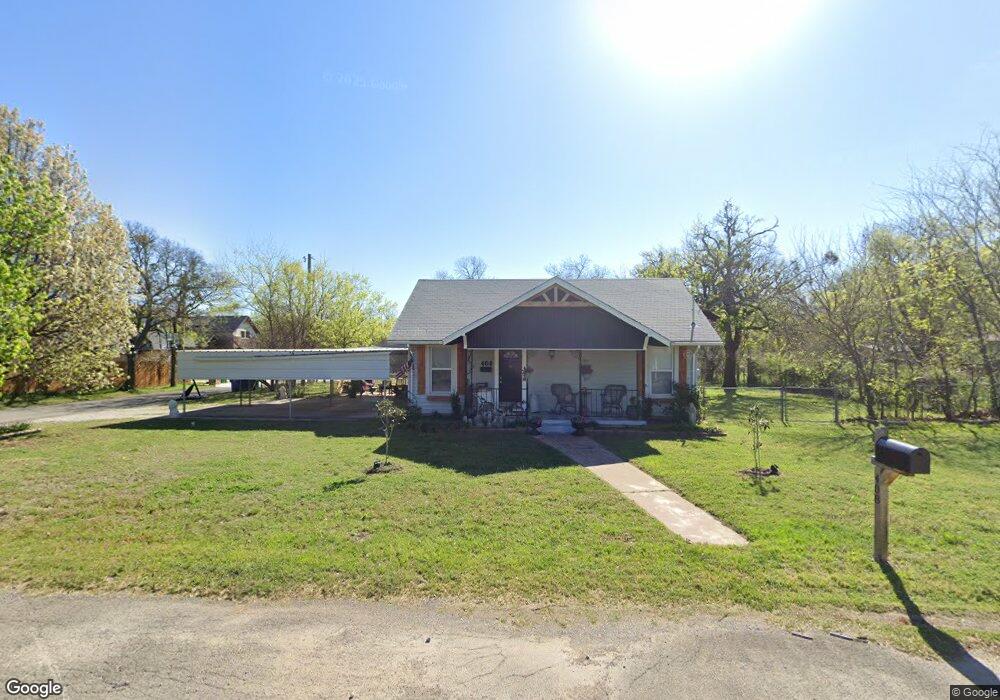
408 N Lane St Decatur, TX 76234
Estimated Value: $269,000 - $350,000
--
Bed
--
Bath
1,869
Sq Ft
$163/Sq Ft
Est. Value
About This Home
This home is located at 408 N Lane St, Decatur, TX 76234 and is currently estimated at $305,269, approximately $163 per square foot. 408 N Lane St is a home located in Wise County with nearby schools including Decatur High School and Victory Christian Academy.
Ownership History
Date
Name
Owned For
Owner Type
Purchase Details
Closed on
Mar 20, 2019
Sold by
Martinez Jose Luis and Martinez Maria Guadalupe
Bought by
Lyons Louiza A and Lyons Zachary A
Current Estimated Value
Home Financials for this Owner
Home Financials are based on the most recent Mortgage that was taken out on this home.
Original Mortgage
$201,286
Outstanding Balance
$176,423
Interest Rate
4.25%
Mortgage Type
FHA
Estimated Equity
$128,846
Purchase Details
Closed on
Jul 23, 2018
Sold by
Suter Imogene
Bought by
Martinez Jose Luis and Martinez Maria Guadalupe
Home Financials for this Owner
Home Financials are based on the most recent Mortgage that was taken out on this home.
Original Mortgage
$50,000
Interest Rate
6.5%
Mortgage Type
Adjustable Rate Mortgage/ARM
Purchase Details
Closed on
Aug 24, 1995
Bought by
Suter Suter C and Suter Imogene
Purchase Details
Closed on
Jan 1, 1901
Bought by
Suter Suter C and Suter Imogene
Create a Home Valuation Report for This Property
The Home Valuation Report is an in-depth analysis detailing your home's value as well as a comparison with similar homes in the area
Home Values in the Area
Average Home Value in this Area
Purchase History
| Date | Buyer | Sale Price | Title Company |
|---|---|---|---|
| Lyons Louiza A | -- | Guardian Title Co | |
| Martinez Jose Luis | -- | Guardian Title Co | |
| Suter Suter C | -- | -- | |
| Suter Suter C | -- | -- |
Source: Public Records
Mortgage History
| Date | Status | Borrower | Loan Amount |
|---|---|---|---|
| Open | Lyons Louiza A | $201,286 | |
| Previous Owner | Martinez Jose Luis | $50,000 |
Source: Public Records
Tax History Compared to Growth
Tax History
| Year | Tax Paid | Tax Assessment Tax Assessment Total Assessment is a certain percentage of the fair market value that is determined by local assessors to be the total taxable value of land and additions on the property. | Land | Improvement |
|---|---|---|---|---|
| 2025 | $3,866 | $297,292 | -- | -- |
| 2024 | $3,866 | $270,265 | $0 | $0 |
| 2023 | $3,804 | $209,695 | $0 | $0 |
| 2022 | $4,175 | $190,632 | $0 | $0 |
| 2021 | $3,955 | $177,000 | $56,280 | $120,720 |
| 2020 | $3,695 | $157,550 | $51,840 | $105,710 |
| 2019 | $3,693 | $149,010 | $51,840 | $97,170 |
| 2018 | $2,728 | $129,810 | $25,230 | $104,580 |
| 2017 | $2,489 | $105,090 | $26,930 | $78,160 |
| 2016 | $2,263 | $98,720 | $26,930 | $71,790 |
| 2015 | -- | $80,830 | $26,930 | $53,900 |
| 2014 | -- | $72,060 | $17,140 | $54,920 |
Source: Public Records
Map
Nearby Homes
- 407 N Lane St
- 700 N Church St
- 304 Cyndilu Ln
- 1 S Martin Extension
- 802 N Church St
- 606 W Mulberry St
- 903 N Miller St
- 602 N Cates St
- 401 S Holman St
- 114 Sondra Lin Blvd
- TBD Farm To Market 51
- 305 E Shoemaker St
- 601 W Brady St
- 307 E Vernon St
- 0 N Hwy 287 Unit 25379920
- 506 E Main St
- 204 W Collins St
- 709 S Church St
- 805 Hollyn Dr
- 809 Hollyn Dr