Estimated Value: $201,588 - $220,000
3
Beds
1
Bath
1,064
Sq Ft
$200/Sq Ft
Est. Value
About This Home
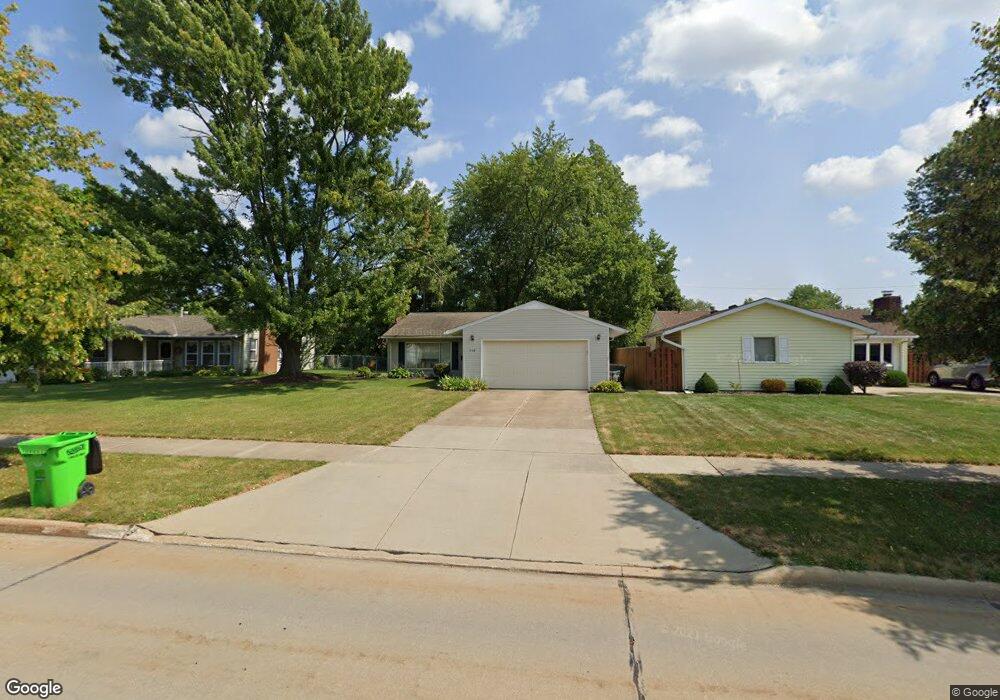
This home is located at 408 Nobottom Rd, Berea, OH 44017 and is currently estimated at $212,397, approximately $199 per square foot. 408 Nobottom Rd is a home located in Cuyahoga County with nearby schools including Grindstone Elementary School, Berea-Midpark Middle School, and Berea-Midpark High School.
Ownership History
Date
Name
Owned For
Owner Type
Purchase Details
Closed on
Nov 17, 2000
Sold by
Tinter John and Tinter Elizabeth M
Bought by
Keller Craig K
Current Estimated Value
Home Financials for this Owner
Home Financials are based on the most recent Mortgage that was taken out on this home.
Original Mortgage
$103,550
Outstanding Balance
$38,129
Interest Rate
7.87%
Estimated Equity
$174,268
Purchase Details
Closed on
Jul 14, 1987
Bought by
Tinter John M
Purchase Details
Closed on
Mar 25, 1987
Sold by
Harbach Terry L
Bought by
Manufacturers Hanover Mort
Purchase Details
Closed on
Mar 28, 1980
Sold by
Cohen Barry S
Bought by
Harbach Terry L
Purchase Details
Closed on
Aug 13, 1976
Sold by
Hampton Thomas and Hampton Elaine D
Bought by
Cohen Barry S
Purchase Details
Closed on
Jan 1, 1975
Bought by
Hampton Thomas and Hampton Elaine D
Create a Home Valuation Report for This Property
The Home Valuation Report is an in-depth analysis detailing your home's value as well as a comparison with similar homes in the area
Home Values in the Area
Average Home Value in this Area
Purchase History
| Date | Buyer | Sale Price | Title Company |
|---|---|---|---|
| Keller Craig K | $109,000 | Approved Statewide Title Age | |
| Tinter John M | $47,000 | -- | |
| Manufacturers Hanover Mort | -- | -- | |
| Harbach Terry L | $54,900 | -- | |
| Cohen Barry S | $38,000 | -- | |
| Hampton Thomas | -- | -- |
Source: Public Records
Mortgage History
| Date | Status | Borrower | Loan Amount |
|---|---|---|---|
| Open | Keller Craig K | $103,550 |
Source: Public Records
Tax History
| Year | Tax Paid | Tax Assessment Tax Assessment Total Assessment is a certain percentage of the fair market value that is determined by local assessors to be the total taxable value of land and additions on the property. | Land | Improvement |
|---|---|---|---|---|
| 2024 | $3,400 | $58,765 | $11,690 | $47,075 |
| 2023 | $3,046 | $44,100 | $9,940 | $34,160 |
| 2022 | $3,027 | $44,100 | $9,940 | $34,160 |
| 2021 | $3,001 | $44,100 | $9,940 | $34,160 |
| 2020 | $2,868 | $37,380 | $8,440 | $28,950 |
| 2019 | $2,791 | $106,800 | $24,100 | $82,700 |
| 2018 | $2,736 | $37,380 | $8,440 | $28,950 |
| 2017 | $2,888 | $36,090 | $7,180 | $28,910 |
| 2016 | $2,866 | $36,090 | $7,180 | $28,910 |
| 2015 | $2,850 | $36,090 | $7,180 | $28,910 |
| 2014 | $2,850 | $37,980 | $7,560 | $30,420 |
Source: Public Records
Map
Nearby Homes
- 379 Laurel Dr
- 428 Park Place
- 446 Redwood Dr
- 487 Karen Dr
- 160 Stonepointe Dr
- 100 River Rock Way
- 725 Shakespeare Dr
- 628 Lindbergh Blvd
- 146 Marian Ln
- 404 Crescent Dr
- 93 W 5th Ave
- 160 Marian Ln Unit 6A
- 6574 Burton Dr
- 211 W Bridge St
- 216 Kraft St
- 287 Edgewood Dr
- 300 West St
- 209 Gibson St
- 56 3rd Ave
- 0 River Rd Unit 5169658
- 414 Nobottom Rd
- 402 Nobottom Rd
- 420 Nobottom Rd
- 398 Nobottom Rd
- 387 Lombardy Dr
- 399 Lombardy Dr
- 375 Lombardy Dr
- 426 Nobottom Rd
- 392 Nobottom Rd
- 405 Nobottom Rd
- 417 Nobottom Rd
- 399 Nobottom Rd
- 405 Lombardy Dr
- 369 Lombardy Dr
- 423 Nobottom Rd
- 393 Nobottom Rd
- 386 Nobottom Rd
- 432 Nobottom Rd
- 363 Lombardy Dr
- 411 Lombardy Dr
Your Personal Tour Guide
Ask me questions while you tour the home.