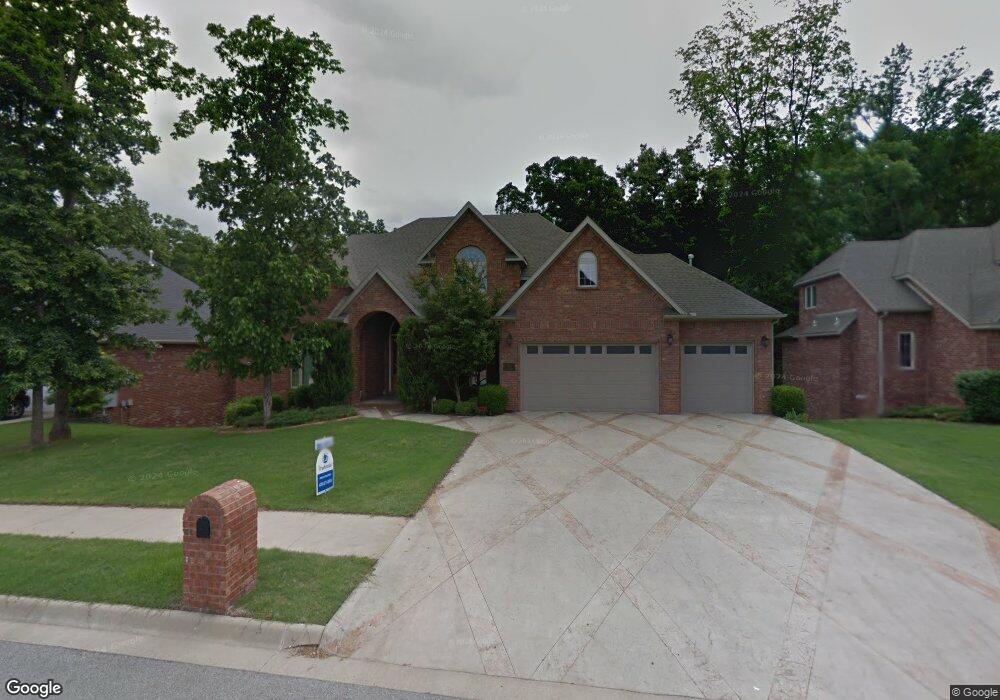
408 NW "O" St Bentonville, AR 72712
Estimated Value: $1,009,000 - $1,374,089
6
Beds
5
Baths
5,700
Sq Ft
$195/Sq Ft
Est. Value
About This Home
This home is located at 408 NW "O" St, Bentonville, AR 72712 and is currently estimated at $1,112,772, approximately $195 per square foot. 408 NW "O" St is a home located in Benton County with nearby schools including Thomas Jefferson Elementary School, Ardis Ann Middle School, and Lincoln Junior High School.
Ownership History
Date
Name
Owned For
Owner Type
Purchase Details
Closed on
Jan 16, 2025
Sold by
Enssle Jennifer and Brown Mitchell
Bought by
Keogh Simon F and Keogh Rochelle S
Current Estimated Value
Home Financials for this Owner
Home Financials are based on the most recent Mortgage that was taken out on this home.
Original Mortgage
$806,000
Outstanding Balance
$800,272
Interest Rate
6.69%
Mortgage Type
New Conventional
Estimated Equity
$312,500
Purchase Details
Closed on
Nov 20, 2016
Sold by
Welling John A and Welling Tonia M
Bought by
Enssle Jennifer and Brown Mitchell
Purchase Details
Closed on
Mar 3, 2006
Sold by
Mumford Wayne and Mumford Marliza
Bought by
Welling John A and Welling Tonia M
Home Financials for this Owner
Home Financials are based on the most recent Mortgage that was taken out on this home.
Original Mortgage
$417,000
Interest Rate
6.05%
Mortgage Type
New Conventional
Create a Home Valuation Report for This Property
The Home Valuation Report is an in-depth analysis detailing your home's value as well as a comparison with similar homes in the area
Home Values in the Area
Average Home Value in this Area
Purchase History
| Date | Buyer | Sale Price | Title Company |
|---|---|---|---|
| Keogh Simon F | $1,018,250 | Meridian Title Company | |
| Enssle Jennifer | $489,900 | Stewart Title Guaranty Compa | |
| Welling John A | $615,000 | None Available |
Source: Public Records
Mortgage History
| Date | Status | Borrower | Loan Amount |
|---|---|---|---|
| Open | Keogh Simon F | $806,000 | |
| Previous Owner | Welling John A | $417,000 |
Source: Public Records
Tax History Compared to Growth
Tax History
| Year | Tax Paid | Tax Assessment Tax Assessment Total Assessment is a certain percentage of the fair market value that is determined by local assessors to be the total taxable value of land and additions on the property. | Land | Improvement |
|---|---|---|---|---|
| 2025 | $7,990 | $176,793 | $24,000 | $152,793 |
| 2024 | $7,661 | $176,793 | $24,000 | $152,793 |
| 2023 | $7,297 | $118,070 | $11,400 | $106,670 |
| 2022 | $6,909 | $115,070 | $11,400 | $103,670 |
| 2021 | $6,885 | $115,070 | $11,400 | $103,670 |
| 2020 | $6,777 | $112,280 | $10,000 | $102,280 |
| 2019 | $6,777 | $112,280 | $10,000 | $102,280 |
| 2018 | $6,802 | $112,280 | $10,000 | $102,280 |
| 2017 | $6,928 | $112,280 | $10,000 | $102,280 |
| 2016 | $6,928 | $112,280 | $10,000 | $102,280 |
| 2015 | $6,401 | $103,570 | $16,000 | $87,570 |
| 2014 | $6,051 | $103,570 | $16,000 | $87,570 |
Source: Public Records
Map
Nearby Homes
- 315 NW O St
- 411 NW Saddlebrook Dr
- 214 El Contento Dr
- 0 NW Olinka Pass St
- 1110 NW 7th St
- 3631 Bitterroot Cove
- 0 SW 2nd St
- 312 NW J St
- 703 NW J St
- 1004 Robin Haven Dr
- 1002 NW 9th St
- 701 NW Ford Ln
- 2605 NW 6th St
- 1201 NW 10th St
- 103 NW J St
- 1402 NW 11th St
- 912 NW 9th St
- 9 NW K Place
- Lot 8 NW H St
- Lot 7 NW H St