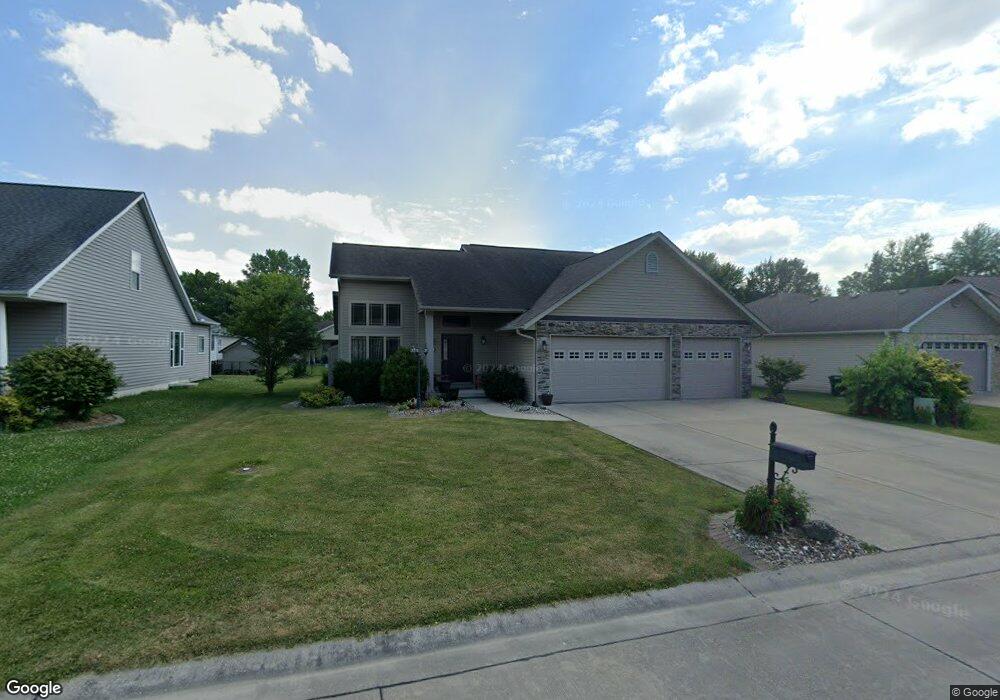
408 Pheasant Ct Worden, IL 62097
Estimated Value: $289,000 - $315,000
3
Beds
3
Baths
1,661
Sq Ft
$182/Sq Ft
Est. Value
About This Home
This home is located at 408 Pheasant Ct, Worden, IL 62097 and is currently estimated at $301,659, approximately $181 per square foot. 408 Pheasant Ct is a home located in Madison County with nearby schools including Worden Elementary School, Hamel Elementary School, and Liberty Middle School.
Ownership History
Date
Name
Owned For
Owner Type
Purchase Details
Closed on
Nov 5, 2010
Sold by
Wildewood Cove Development Inc
Bought by
Freezeland Wesley E and Freezeland Kyongson
Current Estimated Value
Home Financials for this Owner
Home Financials are based on the most recent Mortgage that was taken out on this home.
Original Mortgage
$73,000
Outstanding Balance
$48,409
Interest Rate
4.37%
Mortgage Type
New Conventional
Estimated Equity
$253,250
Purchase Details
Closed on
Mar 28, 2007
Sold by
Hertfelder & Associates Inc
Bought by
Wildwood Cove Development Inc
Home Financials for this Owner
Home Financials are based on the most recent Mortgage that was taken out on this home.
Original Mortgage
$350,000
Interest Rate
7.75%
Mortgage Type
Credit Line Revolving
Create a Home Valuation Report for This Property
The Home Valuation Report is an in-depth analysis detailing your home's value as well as a comparison with similar homes in the area
Purchase History
| Date | Buyer | Sale Price | Title Company |
|---|---|---|---|
| Freezeland Wesley E | $173,000 | Mctc | |
| Wildwood Cove Development Inc | $307,500 | Mctc |
Source: Public Records
Mortgage History
| Date | Status | Borrower | Loan Amount |
|---|---|---|---|
| Open | Freezeland Wesley E | $73,000 | |
| Previous Owner | Wildwood Cove Development Inc | $350,000 |
Source: Public Records
Tax History
| Year | Tax Paid | Tax Assessment Tax Assessment Total Assessment is a certain percentage of the fair market value that is determined by local assessors to be the total taxable value of land and additions on the property. | Land | Improvement |
|---|---|---|---|---|
| 2024 | $6,134 | $86,120 | $3,210 | $82,910 |
| 2023 | $6,134 | $80,230 | $2,990 | $77,240 |
| 2022 | $5,873 | $73,160 | $2,730 | $70,430 |
| 2021 | $5,684 | $74,150 | $2,550 | $71,600 |
| 2020 | $5,478 | $71,150 | $2,450 | $68,700 |
| 2019 | $5,152 | $68,890 | $2,370 | $66,520 |
| 2018 | $5,286 | $66,540 | $2,290 | $64,250 |
| 2017 | $4,684 | $59,250 | $2,700 | $56,550 |
| 2016 | $4,280 | $59,250 | $2,700 | $56,550 |
| 2015 | $3,969 | $56,410 | $2,570 | $53,840 |
| 2014 | $3,969 | $56,410 | $2,570 | $53,840 |
| 2013 | $3,969 | $57,060 | $2,600 | $54,460 |
Source: Public Records
Map
Nearby Homes
- 412 E Donnewald St
- 0 Botterman St
- 307 Sandbach St
- 329 Rutledge St
- 507 N Shirley St
- 103 W Kell St
- 302 Goodall St
- 8728 Wildewood Dr
- 8716 Wildewood Dr
- 0 Possum Hill Rd Unit MIS25066264
- 8221 State Route 4
- 6 Tether Ct
- 134 Colonial Dr
- 6703 Frandsen Rd
- 117 Spring Ct
- 421 Trotter Dr
- 9455 Renken Rd
- 563 Sarah St
- 6611 Quercus Grove Rd
- 512 Nicholls St
- 409 Pheasant Ct
- 405 Pheasant Ct
- 407 E Donnewald St
- 415 E Donnewald St
- 411 E Donnewald St
- 413 Pheasant Ct
- 323 E Donnewald St
- 400 Pheasant Ct
- 420 Pheasant Ct
- 417 Pheasant Ct
- 319 E Donnewald St
- 401 Pheasant Ct
- 421 Pheasant Ct
- 423 E Donnewald St
- 424 Pheasant Ct
- 308 E Donnewald St
- 425 Pheasant Ct
- 416 E Donnewald St
- 322 E Donnewald St
- 428 Pheasant Ct
Your Personal Tour Guide
Ask me questions while you tour the home.