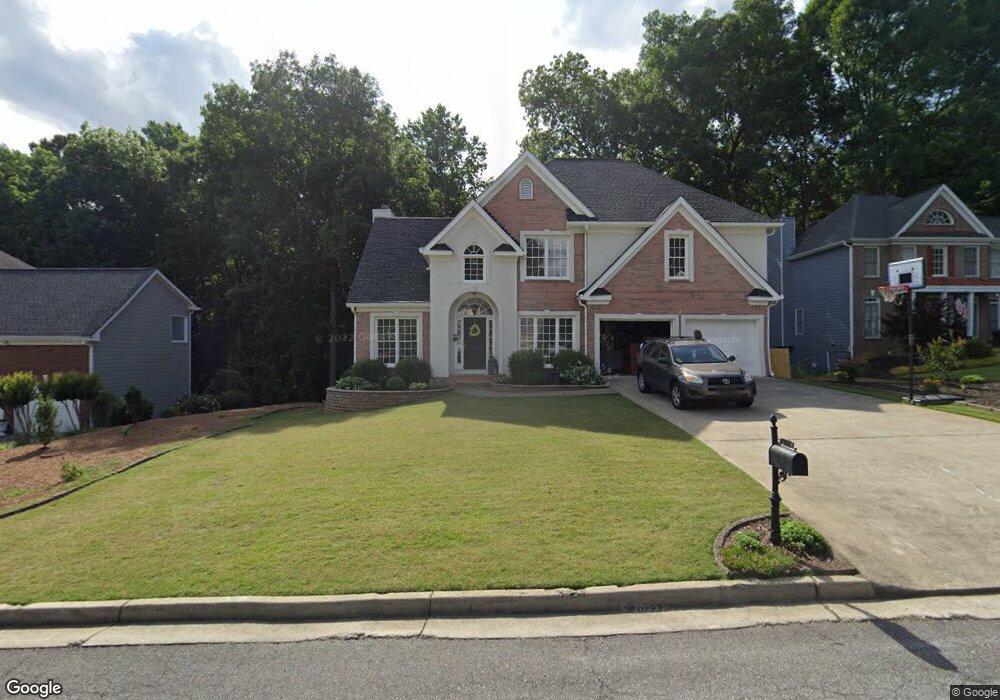
408 Redfield Dr Unit 2 Canton, GA 30114
Oak Grove NeighborhoodEstimated Value: $551,000 - $561,072
5
Beds
4
Baths
3,131
Sq Ft
$178/Sq Ft
Est. Value
About This Home
This home is located at 408 Redfield Dr Unit 2, Canton, GA 30114 and is currently estimated at $556,036, approximately $177 per square foot. 408 Redfield Dr Unit 2 is a home located in Cherokee County with nearby schools including Sixes Elementary School, Freedom Middle School, and Woodstock High School.
Ownership History
Date
Name
Owned For
Owner Type
Purchase Details
Closed on
Jan 31, 2020
Sold by
Hatfield Barbara J
Bought by
Sherwood Josh and Sherwood Danielle
Current Estimated Value
Home Financials for this Owner
Home Financials are based on the most recent Mortgage that was taken out on this home.
Original Mortgage
$280,000
Outstanding Balance
$247,438
Interest Rate
3.72%
Mortgage Type
New Conventional
Estimated Equity
$308,598
Purchase Details
Closed on
Apr 18, 2008
Sold by
Kim Young W
Bought by
Hatfield Barbara J
Home Financials for this Owner
Home Financials are based on the most recent Mortgage that was taken out on this home.
Original Mortgage
$253,300
Interest Rate
6.08%
Mortgage Type
VA
Purchase Details
Closed on
May 25, 2000
Sold by
Jim Labonte Builders Inc
Bought by
Kim Young W
Home Financials for this Owner
Home Financials are based on the most recent Mortgage that was taken out on this home.
Original Mortgage
$198,500
Interest Rate
8.55%
Mortgage Type
New Conventional
Create a Home Valuation Report for This Property
The Home Valuation Report is an in-depth analysis detailing your home's value as well as a comparison with similar homes in the area
Home Values in the Area
Average Home Value in this Area
Purchase History
| Date | Buyer | Sale Price | Title Company |
|---|---|---|---|
| Sherwood Josh | $350,000 | -- | |
| Hatfield Barbara J | $248,000 | -- | |
| Kim Young W | $209,000 | -- |
Source: Public Records
Mortgage History
| Date | Status | Borrower | Loan Amount |
|---|---|---|---|
| Open | Sherwood Josh | $280,000 | |
| Previous Owner | Hatfield Barbara J | $253,300 | |
| Previous Owner | Kim Young W | $198,500 |
Source: Public Records
Tax History Compared to Growth
Tax History
| Year | Tax Paid | Tax Assessment Tax Assessment Total Assessment is a certain percentage of the fair market value that is determined by local assessors to be the total taxable value of land and additions on the property. | Land | Improvement |
|---|---|---|---|---|
| 2025 | $4,982 | $191,956 | $41,200 | $150,756 |
| 2024 | $5,123 | $197,120 | $44,800 | $152,320 |
| 2023 | $5,009 | $192,760 | $41,600 | $151,160 |
| 2022 | $4,191 | $159,440 | $32,000 | $127,440 |
| 2021 | $3,974 | $140,000 | $26,339 | $113,661 |
| 2020 | $1,041 | $128,880 | $24,000 | $104,880 |
| 2019 | $1,012 | $121,240 | $20,800 | $100,440 |
| 2018 | $1,012 | $116,840 | $20,800 | $96,040 |
| 2017 | $945 | $277,500 | $20,800 | $90,200 |
| 2016 | $945 | $251,800 | $20,000 | $80,720 |
| 2015 | $822 | $213,700 | $20,000 | $65,480 |
| 2014 | $798 | $206,500 | $20,000 | $62,600 |
Source: Public Records
Map
Nearby Homes
- 117 Copper Trail Unit I
- 0 Sixes Creek Trail Unit 7197452
- 6055 Golden Landing
- 190 Sixes Creek Trail
- 187 Sixes Creek Trail
- 108 Drury Ln
- 178 Brinson Cir
- 779 Holly St
- 484 Crestmont Ln
- 305 Ridge Rd
- 208 Sawtooth Ct
- 103 Prominence Ct
- 206 Sawtooth Ct
- 345 Meadows Ln
- 421 Crestmont Ln
- 417 Crestmont Ln
- 198 Oak Hill Cir
- 130 Crestmont Dr
- 408 Redfield Dr
- 406 Redfield Dr
- 410 Redfield Dr Unit 2
- 316 Gold Ridge
- 404 Redfield Dr
- 320 Gold Ridge Unit 2
- 412 Redfield Dr Unit 2
- 421 Redfield Dr Unit 2
- 425 Redfield Dr Unit II
- 312 Gold Ridge
- 417 Redfield Dr
- 0 Redfield Dr Unit 3173703
- 0 Redfield Dr
- 324 Gold Ridge Unit 2
- 413 Redfield Dr Unit II
- 308 Gold Ridge
- 402 Redfield Dr Unit 2
- 1075 Copper Creek Dr
- 1079 Copper Creek Dr
- 400 Redfield Dr Unit 2