Estimated Value: $366,000 - $465,000
3
Beds
3
Baths
1,461
Sq Ft
$273/Sq Ft
Est. Value
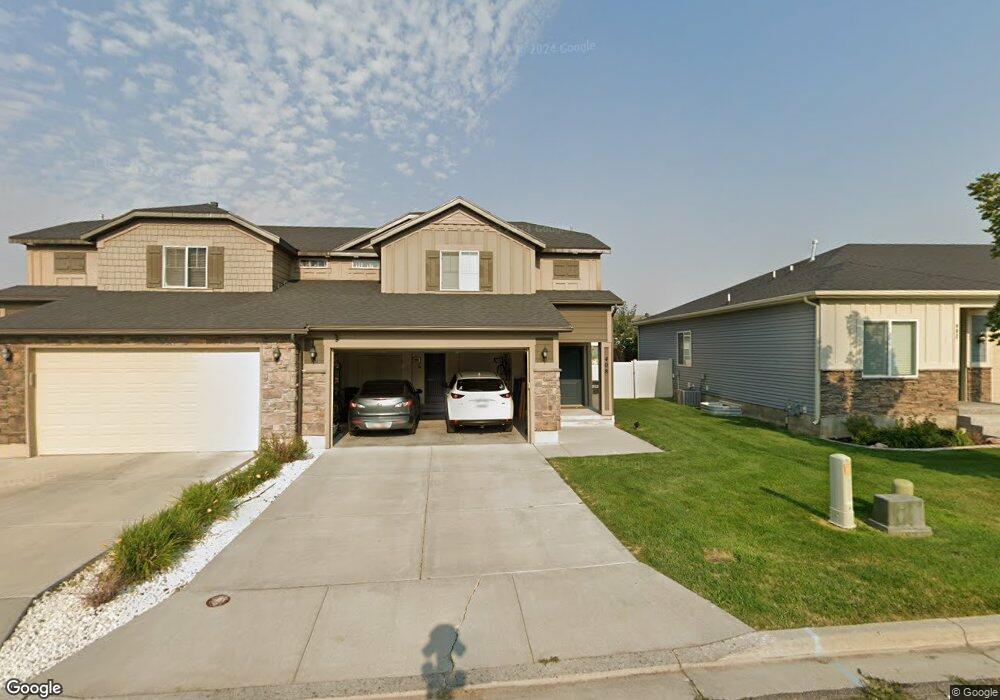
About This Home
This home is located at 408 S 1250 E, Hyrum, UT 84319 and is currently estimated at $399,074, approximately $273 per square foot. 408 S 1250 E is a home located in Cache County with nearby schools including Canyon School, South Cache Middle School, and Mountain Crest High School.
Ownership History
Date
Name
Owned For
Owner Type
Purchase Details
Closed on
Nov 22, 2021
Sold by
Hughes Lauren
Bought by
Young Nathan L and Young Avery Hope
Current Estimated Value
Home Financials for this Owner
Home Financials are based on the most recent Mortgage that was taken out on this home.
Original Mortgage
$276,000
Outstanding Balance
$251,841
Interest Rate
2.99%
Mortgage Type
New Conventional
Estimated Equity
$147,233
Purchase Details
Closed on
Sep 10, 2019
Sold by
Leishman Amy and Davis Amy
Bought by
Hughes Lauren
Home Financials for this Owner
Home Financials are based on the most recent Mortgage that was taken out on this home.
Original Mortgage
$222,584
Interest Rate
3.7%
Mortgage Type
VA
Purchase Details
Closed on
May 1, 2013
Sold by
Mckay Dev Hyrum Llc
Bought by
Leishman Amy
Home Financials for this Owner
Home Financials are based on the most recent Mortgage that was taken out on this home.
Original Mortgage
$145,153
Interest Rate
3.51%
Mortgage Type
New Conventional
Create a Home Valuation Report for This Property
The Home Valuation Report is an in-depth analysis detailing your home's value as well as a comparison with similar homes in the area
Home Values in the Area
Average Home Value in this Area
Purchase History
| Date | Buyer | Sale Price | Title Company |
|---|---|---|---|
| Young Nathan L | -- | Us Title | |
| Hughes Lauren | -- | American Secure Title Logan | |
| Leishman Amy | -- | Heritage Title Ins Ag Inc Lo |
Source: Public Records
Mortgage History
| Date | Status | Borrower | Loan Amount |
|---|---|---|---|
| Open | Young Nathan L | $276,000 | |
| Previous Owner | Hughes Lauren | $222,584 | |
| Previous Owner | Leishman Amy | $145,153 |
Source: Public Records
Tax History
| Year | Tax Paid | Tax Assessment Tax Assessment Total Assessment is a certain percentage of the fair market value that is determined by local assessors to be the total taxable value of land and additions on the property. | Land | Improvement |
|---|---|---|---|---|
| 2025 | $1,329 | $346,993 | $95,000 | $251,993 |
| 2024 | $1,285 | $313,237 | $95,000 | $218,237 |
| 2023 | $1,562 | $364,000 | $61,500 | $302,500 |
| 2022 | $1,630 | $364,000 | $61,500 | $302,500 |
| 2021 | $1,288 | $243,775 | $61,500 | $182,275 |
| 2020 | $1,239 | $220,000 | $61,500 | $158,500 |
| 2019 | $1,145 | $191,250 | $32,750 | $158,500 |
| 2018 | $890 | $143,735 | $32,750 | $110,985 |
| 2017 | $909 | $76,150 | $0 | $0 |
| 2016 | $929 | $76,150 | $0 | $0 |
| 2015 | $931 | $76,150 | $0 | $0 |
| 2014 | $911 | $76,150 | $0 | $0 |
| 2013 | $372 | $49,940 | $0 | $0 |
Source: Public Records
Map
Nearby Homes
Your Personal Tour Guide
Ask me questions while you tour the home.