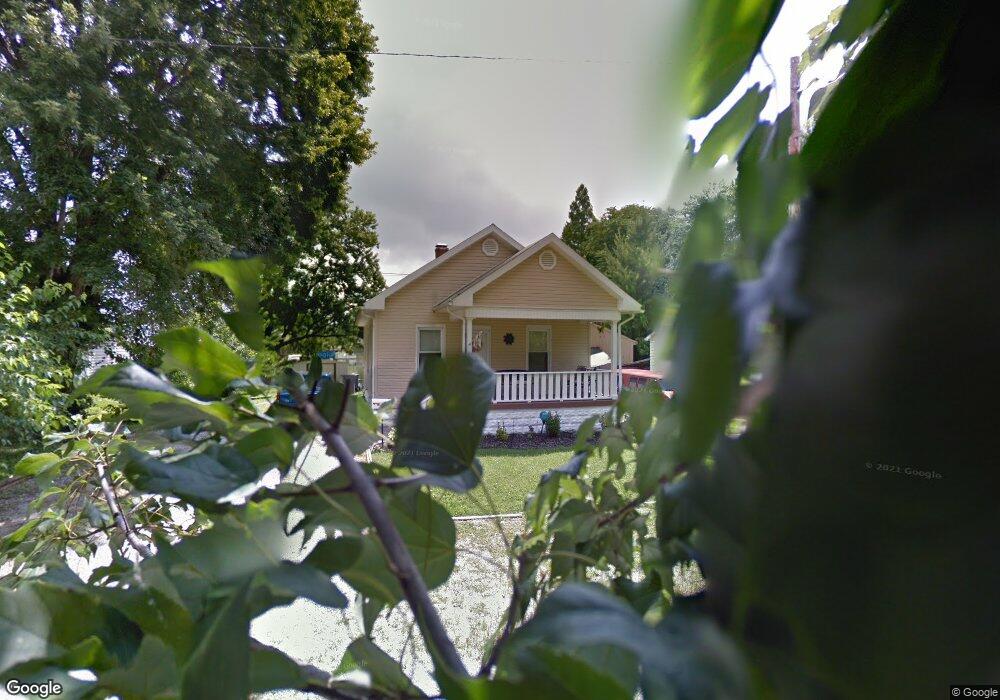
408 S Elm Ave Evansville, IN 47712
Estimated Value: $128,193 - $132,000
2
Beds
1
Bath
864
Sq Ft
$151/Sq Ft
Est. Value
About This Home
This home is located at 408 S Elm Ave, Evansville, IN 47712 and is currently estimated at $130,298, approximately $150 per square foot. 408 S Elm Ave is a home located in Vanderburgh County with nearby schools including Tekoppel Elementary School, Helfrich Park STEM Academy, and Francis Joseph Reitz High School.
Ownership History
Date
Name
Owned For
Owner Type
Purchase Details
Closed on
Apr 5, 2023
Sold by
Bivins Bo R
Bought by
Smith Garrett
Current Estimated Value
Home Financials for this Owner
Home Financials are based on the most recent Mortgage that was taken out on this home.
Original Mortgage
$93,600
Outstanding Balance
$90,951
Interest Rate
6.5%
Mortgage Type
New Conventional
Estimated Equity
$39,347
Purchase Details
Closed on
Jun 15, 2016
Sold by
Gabert Andrew and Gabert Jamie
Bought by
Bivins Bo R
Home Financials for this Owner
Home Financials are based on the most recent Mortgage that was taken out on this home.
Original Mortgage
$3,100
Interest Rate
3.58%
Mortgage Type
New Conventional
Purchase Details
Closed on
Nov 7, 2008
Sold by
Antes Ryan M
Bought by
Gabert Andrew and Gabert Jamie
Home Financials for this Owner
Home Financials are based on the most recent Mortgage that was taken out on this home.
Original Mortgage
$65,018
Interest Rate
6.09%
Mortgage Type
FHA
Create a Home Valuation Report for This Property
The Home Valuation Report is an in-depth analysis detailing your home's value as well as a comparison with similar homes in the area
Home Values in the Area
Average Home Value in this Area
Purchase History
| Date | Buyer | Sale Price | Title Company |
|---|---|---|---|
| Smith Garrett | $117,000 | Regional Title | |
| Bivins Bo R | -- | Columbia Title | |
| Gabert Andrew | -- | None Available |
Source: Public Records
Mortgage History
| Date | Status | Borrower | Loan Amount |
|---|---|---|---|
| Open | Smith Garrett | $93,600 | |
| Previous Owner | Bivins Bo R | $3,100 | |
| Previous Owner | Bivins Bo R | $76,095 | |
| Previous Owner | Gabert Andrew | $65,018 |
Source: Public Records
Tax History Compared to Growth
Tax History
| Year | Tax Paid | Tax Assessment Tax Assessment Total Assessment is a certain percentage of the fair market value that is determined by local assessors to be the total taxable value of land and additions on the property. | Land | Improvement |
|---|---|---|---|---|
| 2024 | $570 | $68,700 | $13,700 | $55,000 |
| 2023 | $539 | $65,900 | $13,200 | $52,700 |
| 2022 | $486 | $66,200 | $13,200 | $53,000 |
| 2021 | $477 | $61,700 | $13,200 | $48,500 |
| 2020 | $459 | $61,700 | $13,200 | $48,500 |
| 2019 | $454 | $61,700 | $13,200 | $48,500 |
| 2018 | $444 | $61,700 | $13,200 | $48,500 |
| 2017 | $432 | $60,900 | $13,200 | $47,700 |
| 2016 | $415 | $60,800 | $13,200 | $47,600 |
| 2014 | $399 | $59,600 | $13,200 | $46,400 |
| 2013 | -- | $55,200 | $13,200 | $42,000 |
Source: Public Records
Map
Nearby Homes
- 301 S Elm Ave
- 3416 Marion Ave
- 115 N Woods Ave
- 111 Wills Ave
- 3301 Austin Ave
- 200 Rupper Ave
- 304 N Tekoppel Ave
- 3008 Edgewood Dr
- 3207 W Franklin St
- 3011 Forest Ave
- 3324 W Virginia St
- 210 Leslie Ave
- 3030 W Franklin St
- 2820 Hillcrest Terrace
- 2908 W Indiana St
- 3106 Mount Vernon Ave
- 2721 Marion Ave
- 2806 W Franklin St
- 2813 W Franklin St
- 4129 Kedzie Ave
- 410 S Elm Ave
- 404 S Elm Ave
- 331 S Elm Ave
- 207 S Tekoppel Ave
- 213 S Tekoppel Ave
- 327 S Elm Ave
- 203 S Tekoppel Ave
- 323 S Elm Ave
- 3519 Yuletide Ave
- 3515 Yuletide Ave
- 406 S Woods Ave
- 400 S Woods Ave
- 117 S Tekoppel Ave
- 314 S Elm Ave
- 315 S Elm Ave
- 322 S Woods Ave
- 310 S Elm Ave
- 200 S Tekoppel Ave
- 313 S Elm Ave
- 223 S Tekoppel Ave