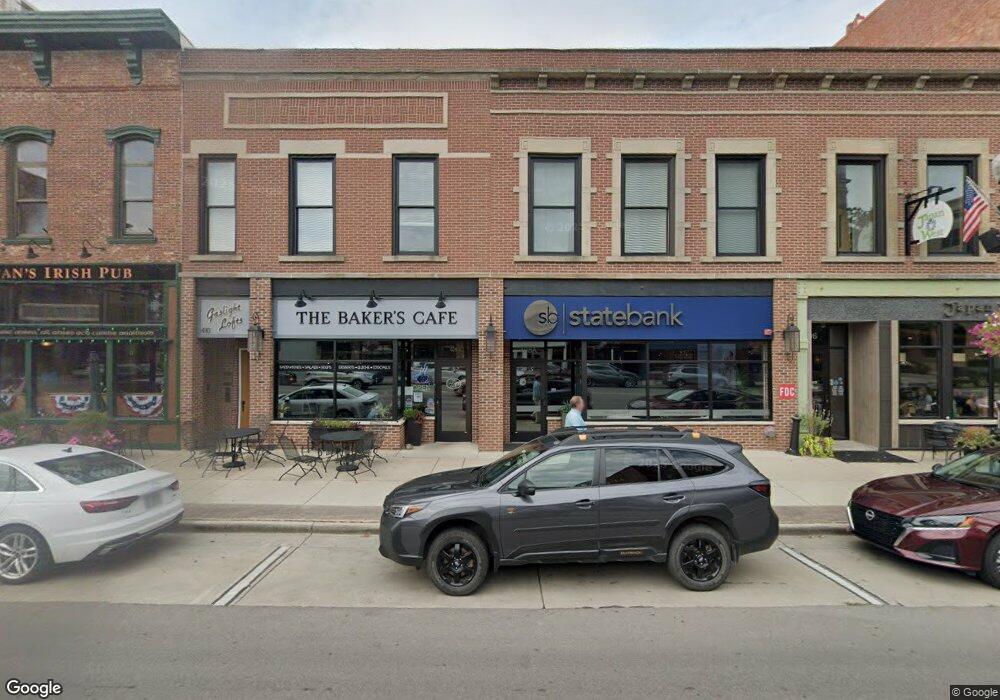
408 S Main St Findlay, OH 45840
--
Bed
--
Bath
3,675
Sq Ft
4,792
Sq Ft Lot
About This Home
This home is located at 408 S Main St, Findlay, OH 45840. 408 S Main St is a home located in Hancock County with nearby schools including Lincoln Elementary School, Donnell Middle School, and Findlay High School.
Ownership History
Date
Name
Owned For
Owner Type
Purchase Details
Closed on
Oct 14, 2022
Sold by
Nickolas Xi Llc
Bought by
Ajg Investment Holdings Llc
Home Financials for this Owner
Home Financials are based on the most recent Mortgage that was taken out on this home.
Original Mortgage
$1,732,361
Interest Rate
6.02%
Mortgage Type
New Conventional
Purchase Details
Closed on
Apr 13, 2018
Sold by
Brilliant Real Estate Llc
Bought by
Nickolas Xi Llc
Purchase Details
Closed on
Dec 2, 2011
Sold by
Marckel Donna R and Marckel James E
Bought by
Brilliant Real Estate Llc
Purchase Details
Closed on
Nov 3, 1995
Sold by
Montant Corp
Bought by
James and Marckel Donna
Home Financials for this Owner
Home Financials are based on the most recent Mortgage that was taken out on this home.
Original Mortgage
$88,000
Interest Rate
7.61%
Mortgage Type
New Conventional
Purchase Details
Closed on
Aug 9, 1991
Bought by
Montant Corporation
Create a Home Valuation Report for This Property
The Home Valuation Report is an in-depth analysis detailing your home's value as well as a comparison with similar homes in the area
Home Values in the Area
Average Home Value in this Area
Purchase History
| Date | Buyer | Sale Price | Title Company |
|---|---|---|---|
| Ajg Investment Holdings Llc | -- | -- | |
| Ajg Investment Holdings Llc | -- | None Listed On Document | |
| Nickolas Xi Llc | $215,000 | None Available | |
| Brilliant Real Estate Llc | $180,000 | Hancock Title | |
| James | $110,000 | -- | |
| Montant Corporation | $26,400 | -- |
Source: Public Records
Mortgage History
| Date | Status | Borrower | Loan Amount |
|---|---|---|---|
| Previous Owner | Ajg Investment Holdings Llc | $1,732,361 | |
| Previous Owner | James | $88,000 |
Source: Public Records
Tax History Compared to Growth
Tax History
| Year | Tax Paid | Tax Assessment Tax Assessment Total Assessment is a certain percentage of the fair market value that is determined by local assessors to be the total taxable value of land and additions on the property. | Land | Improvement |
|---|---|---|---|---|
| 2024 | $1,158 | $19,780 | $12,370 | $7,410 |
| 2023 | $1,110 | $19,780 | $12,370 | $7,410 |
| 2022 | $6,732 | $118,240 | $12,370 | $105,870 |
| 2021 | $7,644 | $116,450 | $9,890 | $106,560 |
| 2020 | $4,193 | $64,900 | $9,890 | $55,010 |
| 2019 | $1,214 | $16,700 | $9,890 | $6,810 |
| 2018 | $1,095 | $16,700 | $9,890 | $6,810 |
| 2017 | $1,245 | $16,700 | $9,890 | $6,810 |
| 2016 | $1,261 | $16,700 | $9,890 | $6,810 |
| 2015 | $1,255 | $17,090 | $8,580 | $8,510 |
| 2014 | $1,259 | $17,090 | $8,580 | $8,510 |
| 2012 | $1,267 | $17,090 | $8,580 | $8,510 |
Source: Public Records
Map
Nearby Homes
- 514 Liberty St
- 720 S West St
- 419 W Lincoln St
- 407 Washington St
- 829 Maple Ave
- 225 Lima Ave
- 0 Canadian Way Unit 20253551
- 0 Canadian Way Unit 6135400
- 202 Hancock St
- 817 Park St
- 905 S West St
- 213 Cherry St
- 412 Lima Ave
- 416 1/2 Lima Ave
- 420 1st St
- 801 W Sandusky St
- 545 Clinton Ct
- 523 Center St
- 512 N Cory St
- 1115 Liberty St
- 418 S Main St Unit 2nd, 3rd
- 418 S Main St
- 411 S Main St
- 410 S Main St
- 410 S Main St Unit 2
- 410 S Main St Unit 3
- 410 S Main St Unit 4
- 410 S Main St Unit 2
- 410 S Main St Unit 1
- 401 S Main St
- 414 S Main St
- 0 Viburnum Ct Lot 88 Unit 6069342
- 0 Viburnum Ct Lot 88 Unit H136138
- 0 Diamondback Ct Lot 143 Unit 138695
- 0 Diamondback Ct Unit 20211458
- 0 Diamondback Ct Unit 207711
- 0 Diamondback Ct Unit 6069314
- 0 Diamondback Ct Unit H138695
- 0 Diamondback Ct Unit H131264
- 0 Diamondback Ct Unit H131263