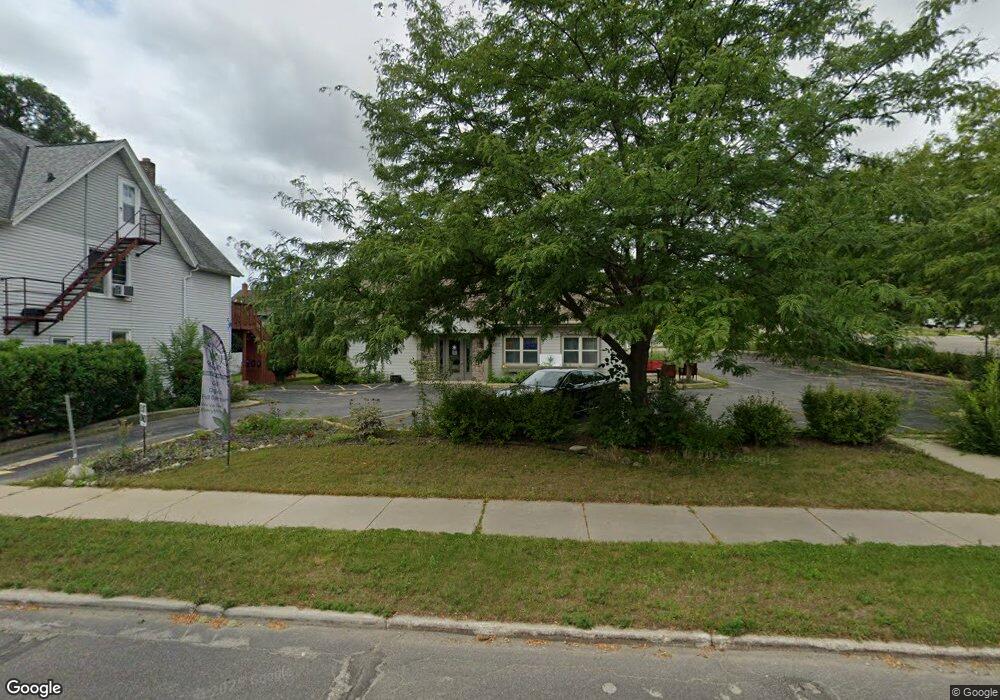
408 S Main St West Bend, WI 53095
Estimated Value: $224,000 - $291,000
2
Beds
1
Bath
1,104
Sq Ft
$231/Sq Ft
Est. Value
About This Home
This home is located at 408 S Main St, West Bend, WI 53095 and is currently estimated at $254,727, approximately $230 per square foot. 408 S Main St is a home located in Washington County with nearby schools including McLane Elementary School, Badger Middle School, and East High School.
Ownership History
Date
Name
Owned For
Owner Type
Purchase Details
Closed on
Aug 11, 2023
Sold by
Walczyk Jeffrey R and Walczyk Kathryn
Bought by
Jeffrey R And Kathryn Walczyk Revocable and Walczyk
Current Estimated Value
Purchase Details
Closed on
Jan 20, 2015
Sold by
Federal Home Loan Mortgage Corporation
Bought by
Walczyk Kathryn
Purchase Details
Closed on
Jul 24, 2014
Sold by
Jaeger Brian
Bought by
Federal Home Loan Mortgage Corporation
Create a Home Valuation Report for This Property
The Home Valuation Report is an in-depth analysis detailing your home's value as well as a comparison with similar homes in the area
Home Values in the Area
Average Home Value in this Area
Purchase History
| Date | Buyer | Sale Price | Title Company |
|---|---|---|---|
| Jeffrey R And Kathryn Walczyk Revocable | -- | -- | |
| Walczyk Jeffrey R | -- | -- | |
| Walczyk Kathryn | -- | Stewart Title Company | |
| Federal Home Loan Mortgage Corporation | $37,800 | -- |
Source: Public Records
Tax History Compared to Growth
Tax History
| Year | Tax Paid | Tax Assessment Tax Assessment Total Assessment is a certain percentage of the fair market value that is determined by local assessors to be the total taxable value of land and additions on the property. | Land | Improvement |
|---|---|---|---|---|
| 2024 | $2,894 | $212,400 | $40,300 | $172,100 |
| 2023 | $2,627 | $212,400 | $40,300 | $172,100 |
| 2022 | $2,954 | $165,000 | $35,100 | $129,900 |
| 2021 | $2,125 | $114,700 | $35,100 | $79,600 |
| 2020 | $1,432 | $80,800 | $35,100 | $45,700 |
| 2019 | $1,414 | $80,800 | $35,100 | $45,700 |
| 2018 | $1,358 | $79,700 | $35,100 | $44,600 |
| 2017 | $1,299 | $79,700 | $35,100 | $44,600 |
| 2016 | $1,307 | $79,700 | $35,100 | $44,600 |
| 2015 | $2,786 | $79,700 | $35,100 | $44,600 |
| 2014 | $2,786 | $125,400 | $35,100 | $90,300 |
| 2013 | $2,355 | $125,400 | $35,100 | $90,300 |
Source: Public Records
Map
Nearby Homes
- 403 S Main St
- 261 S Main St
- 546 S Main St
- 255 S Main St
- 247 S Main St
- 243 S Main St
- 318 E Kilbourn Ave
- 113 S 7th Ave
- 139 N 6th Ave
- 108 Edgewood Ln
- 301 N Main St
- 230 N 7th Ave
- 128 Wilson Ave
- 1047 W Washington St
- 801 E Washington St
- 1325 Stirling Ct
- Lt0 Wisconsin 33
- 1040 Lincoln Dr W
- 1014 Cottonwood Ct
- 247 S 17th Ave