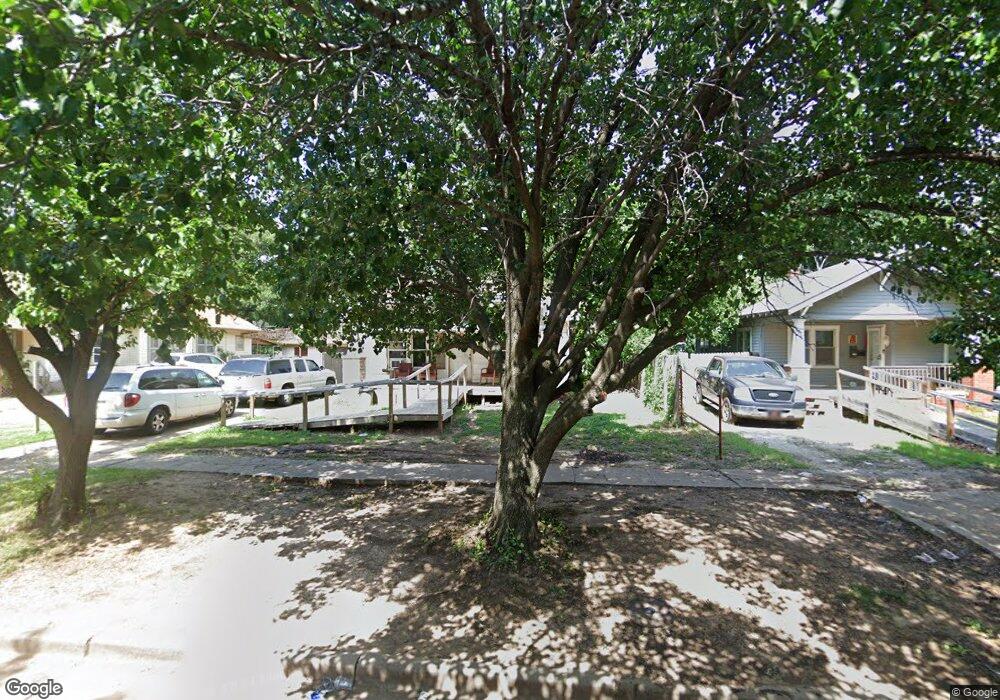
408 S Palm St Ponca City, OK 74601
Estimated Value: $63,000 - $80,000
3
Beds
2
Baths
1,736
Sq Ft
$41/Sq Ft
Est. Value
About This Home
This home is located at 408 S Palm St, Ponca City, OK 74601 and is currently estimated at $70,924, approximately $40 per square foot. 408 S Palm St is a home located in Kay County with nearby schools including Lincoln Elementary School, Ponca City West Middle School, and Ponca City East Middle School.
Ownership History
Date
Name
Owned For
Owner Type
Purchase Details
Closed on
Sep 20, 2006
Sold by
Pruett Bert A and Pruett Cindy L
Bought by
Rhodd Deanna
Current Estimated Value
Purchase Details
Closed on
Nov 10, 2005
Sold by
Pruett Bert A and Pruett Cindy L
Bought by
Pruett Bert A and Pruett Cindy L
Home Financials for this Owner
Home Financials are based on the most recent Mortgage that was taken out on this home.
Original Mortgage
$21,000
Interest Rate
6.04%
Mortgage Type
Future Advance Clause Open End Mortgage
Purchase Details
Closed on
Nov 8, 2005
Sold by
Commercial Federal Bank
Bought by
Pruett Bert
Home Financials for this Owner
Home Financials are based on the most recent Mortgage that was taken out on this home.
Original Mortgage
$21,000
Interest Rate
6.04%
Mortgage Type
Future Advance Clause Open End Mortgage
Purchase Details
Closed on
Mar 29, 2005
Sold by
Haze Preston
Bought by
Commercial Federal Bank
Purchase Details
Closed on
Sep 7, 1995
Create a Home Valuation Report for This Property
The Home Valuation Report is an in-depth analysis detailing your home's value as well as a comparison with similar homes in the area
Home Values in the Area
Average Home Value in this Area
Purchase History
| Date | Buyer | Sale Price | Title Company |
|---|---|---|---|
| Rhodd Deanna | $40,000 | -- | |
| Pruett Bert A | -- | -- | |
| Pruett Bert | $17,000 | -- | |
| Commercial Federal Bank | -- | -- | |
| -- | $33,000 | -- |
Source: Public Records
Mortgage History
| Date | Status | Borrower | Loan Amount |
|---|---|---|---|
| Previous Owner | Pruett Bert A | $21,000 | |
| Previous Owner | Pruett Bert | $21,000 |
Source: Public Records
Tax History Compared to Growth
Tax History
| Year | Tax Paid | Tax Assessment Tax Assessment Total Assessment is a certain percentage of the fair market value that is determined by local assessors to be the total taxable value of land and additions on the property. | Land | Improvement |
|---|---|---|---|---|
| 2024 | $264 | $3,793 | $308 | $3,485 |
| 2023 | $264 | $3,682 | $308 | $3,374 |
| 2022 | $245 | $3,575 | $308 | $3,267 |
| 2021 | $246 | $3,575 | $308 | $3,267 |
| 2020 | $235 | $3,484 | $308 | $3,176 |
| 2019 | $228 | $3,383 | $308 | $3,075 |
| 2018 | $243 | $3,514 | $308 | $3,206 |
| 2017 | $241 | $3,464 | $308 | $3,156 |
| 2016 | $234 | $3,363 | $308 | $3,055 |
| 2015 | $229 | $3,306 | $308 | $2,998 |
| 2014 | $296 | $4,036 | $308 | $3,728 |
Source: Public Records
Map
Nearby Homes