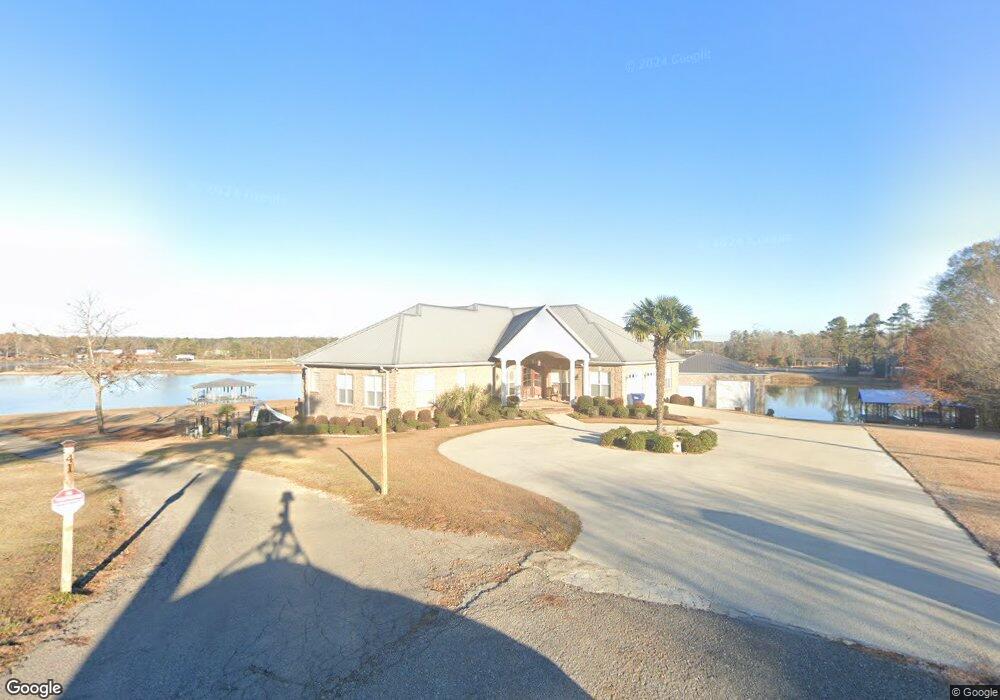
408 Turner Rd Pell City, AL 35128
Estimated Value: $732,000 - $1,469,000
--
Bed
3
Baths
3,985
Sq Ft
$284/Sq Ft
Est. Value
About This Home
This home is located at 408 Turner Rd, Pell City, AL 35128 and is currently estimated at $1,133,721, approximately $284 per square foot. 408 Turner Rd is a home located in St. Clair County.
Ownership History
Date
Name
Owned For
Owner Type
Purchase Details
Closed on
Nov 14, 2016
Bought by
Burrow Brenda and Burrow David
Current Estimated Value
Home Financials for this Owner
Home Financials are based on the most recent Mortgage that was taken out on this home.
Original Mortgage
$383,000
Outstanding Balance
$308,929
Interest Rate
3.57%
Estimated Equity
$824,792
Purchase Details
Closed on
Mar 6, 2015
Sold by
Burrow David J and The David J Burrow And Brenda
Bought by
Burrow David J and Burrow Brenda
Purchase Details
Closed on
Jul 26, 2010
Sold by
Reed Susan Dean and Foster Robin Houston
Bought by
Burrow David J and Burrow Brenda
Purchase Details
Closed on
Mar 11, 2008
Sold by
Davis Steven H and Davis Joshua S
Bought by
Davis Joshua S and Davis Meghann S
Home Financials for this Owner
Home Financials are based on the most recent Mortgage that was taken out on this home.
Original Mortgage
$370,000
Interest Rate
5.97%
Mortgage Type
New Conventional
Purchase Details
Closed on
Jun 27, 2006
Sold by
Uptain Brenda
Bought by
David J Burrow & Brenda Burrow Living Tr
Create a Home Valuation Report for This Property
The Home Valuation Report is an in-depth analysis detailing your home's value as well as a comparison with similar homes in the area
Home Values in the Area
Average Home Value in this Area
Purchase History
| Date | Buyer | Sale Price | Title Company |
|---|---|---|---|
| Burrow Brenda | -- | -- | |
| Burrow David J | $679,000 | None Available | |
| Burrow David J | -- | -- | |
| Davis Joshua S | -- | None Available | |
| David J Burrow & Brenda Burrow Living Tr | $165,000 | None Available |
Source: Public Records
Mortgage History
| Date | Status | Borrower | Loan Amount |
|---|---|---|---|
| Open | Burrow David J | $383,000 | |
| Closed | Burrow David J | -- | |
| Previous Owner | Davis Joshua S | $370,000 |
Source: Public Records
Tax History Compared to Growth
Tax History
| Year | Tax Paid | Tax Assessment Tax Assessment Total Assessment is a certain percentage of the fair market value that is determined by local assessors to be the total taxable value of land and additions on the property. | Land | Improvement |
|---|---|---|---|---|
| 2024 | $4,236 | $208,932 | $39,200 | $169,732 |
| 2023 | $4,097 | $208,932 | $39,200 | $169,732 |
| 2022 | $3,636 | $89,843 | $20,800 | $69,043 |
| 2021 | $2,862 | $89,843 | $20,800 | $69,043 |
| 2020 | $2,600 | $80,838 | $20,800 | $60,038 |
| 2019 | $2,600 | $73,558 | $13,520 | $60,038 |
| 2018 | $2,364 | $67,000 | $0 | $0 |
| 2017 | $2,395 | $67,000 | $0 | $0 |
| 2016 | $2,364 | $67,000 | $0 | $0 |
| 2015 | $2,395 | $66,520 | $0 | $0 |
| 2014 | $2,395 | $67,860 | $0 | $0 |
Source: Public Records
Map
Nearby Homes
- 9190 Meeting St
- 9232 Meeting St
- 9170 Meeting St Unit 30
- 9160 Meeting St Unit 29
- 3140 Boardwalk Ln
- 5892 Horizons Pkwy Unit 73
- 6526 Rainbow Row
- 6025 Rainbow Row
- 600 Tutwiler Dr
- 100 Holiday Estates Dr
- 2908 Martin St S
- 203 Brookshire Ln
- 4906 Masters Rd
- 60 Clover Dr
- 215 Hayden Dr
- 27 Morning Glory Dr
- 748 Pine Harbor Rd
- 1180 Images Square
- 110 Sage Dr
- 130 Sage Dr
- 411 Turner Rd
- 411 Turner Rd
- 409 Turner Rd
- 410 Turner Rd
- 414 Turner Rd
- 405 Turner Rd
- 400 Turner Rd
- 9171 Meeting St
- 10025 Meeting St
- 9145 Meeting St
- 9257 Meeting St
- 9225 Meeting St
- 9241 Meeting St
- 10045 Meeting St
- 10015 Meeting St
- 9199 Meeting St
- 9107 Meeting St
- 9106 Meeting St
- 10030 Meeting St
- 10020 Meeting St