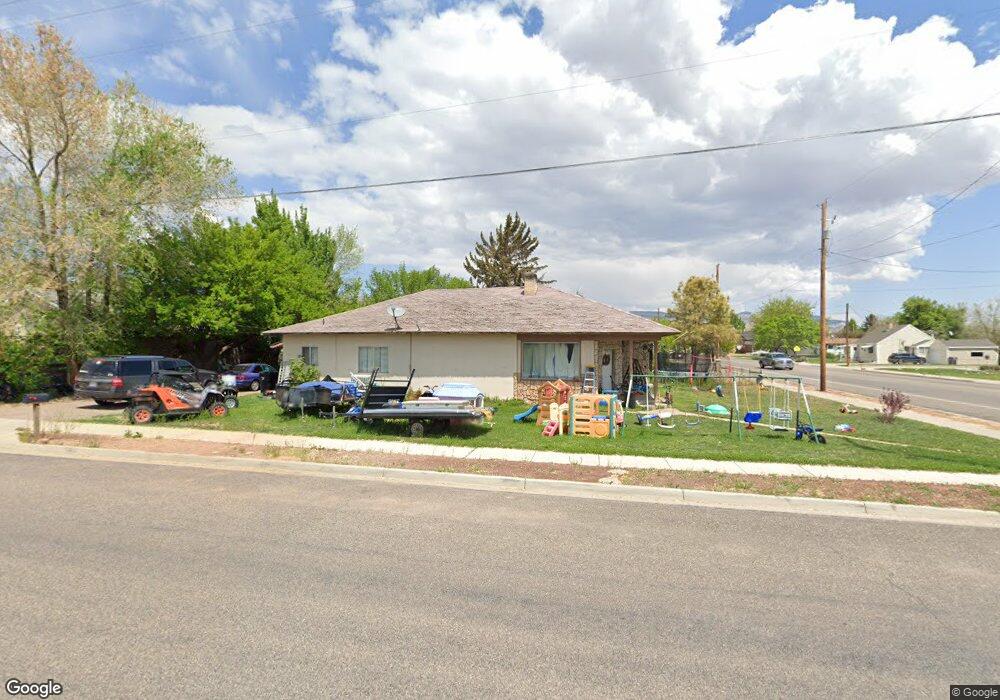
408 W 200 S Richfield, UT 84701
Estimated Value: $265,000 - $318,000
3
Beds
2
Baths
1,910
Sq Ft
$148/Sq Ft
Est. Value
About This Home
This home is located at 408 W 200 S, Richfield, UT 84701 and is currently estimated at $281,738, approximately $147 per square foot. 408 W 200 S is a home located in Sevier County with nearby schools including Ashman School, Pahvant School, and Red Hills Middle School.
Ownership History
Date
Name
Owned For
Owner Type
Purchase Details
Closed on
Mar 28, 2018
Sold by
Larsen Landon and Larsen Shandra
Bought by
Larsen Landon H and Larsen Shandra L
Current Estimated Value
Home Financials for this Owner
Home Financials are based on the most recent Mortgage that was taken out on this home.
Original Mortgage
$65,185
Outstanding Balance
$55,980
Interest Rate
4.38%
Estimated Equity
$225,758
Purchase Details
Closed on
Dec 22, 2017
Sold by
Federal Home Loan Mortgage Corporation
Bought by
Larsen Shandra and Larsen Landon
Purchase Details
Closed on
Apr 11, 2017
Sold by
Esquivel Norma
Bought by
Federal Home Loan Mortgage Corporation
Purchase Details
Closed on
Mar 29, 2005
Sold by
Hatch Deloy and Hatch Macray
Bought by
Esquivel Norma
Home Financials for this Owner
Home Financials are based on the most recent Mortgage that was taken out on this home.
Original Mortgage
$67,500
Interest Rate
6.99%
Mortgage Type
Adjustable Rate Mortgage/ARM
Create a Home Valuation Report for This Property
The Home Valuation Report is an in-depth analysis detailing your home's value as well as a comparison with similar homes in the area
Home Values in the Area
Average Home Value in this Area
Purchase History
| Date | Buyer | Sale Price | Title Company |
|---|---|---|---|
| Larsen Landon H | -- | D Land Title | |
| Larsen Shandra | -- | Inwest Title Services Inc | |
| Federal Home Loan Mortgage Corporation | -- | None Available | |
| Esquivel Norma | -- | First American Title Ins Age |
Source: Public Records
Mortgage History
| Date | Status | Borrower | Loan Amount |
|---|---|---|---|
| Open | Larsen Landon H | $65,185 | |
| Previous Owner | Esquivel Norma | $67,500 |
Source: Public Records
Tax History Compared to Growth
Tax History
| Year | Tax Paid | Tax Assessment Tax Assessment Total Assessment is a certain percentage of the fair market value that is determined by local assessors to be the total taxable value of land and additions on the property. | Land | Improvement |
|---|---|---|---|---|
| 2024 | $1,109 | $116,568 | $40,535 | $76,033 |
| 2023 | $1,153 | $125,305 | $36,760 | $88,545 |
| 2022 | $1,161 | $106,017 | $35,723 | $70,294 |
| 2021 | $1,069 | $82,167 | $32,831 | $49,336 |
| 2020 | $899 | $67,196 | $19,958 | $47,238 |
| 2019 | $751 | $59,370 | $16,630 | $42,740 |
| 2018 | $750 | $53,150 | $16,630 | $36,520 |
| 2017 | $716 | $48,440 | $16,630 | $31,810 |
| 2016 | $590 | $48,440 | $0 | $0 |
| 2015 | $590 | $47,360 | $0 | $0 |
| 2014 | $590 | $45,030 | $0 | $0 |
Source: Public Records
Map
Nearby Homes
- 208 S 400 W
- 210 S 500 W
- 358 W 100 S
- 280 S 100 W
- 128 W 100 N
- 797 W 50 N
- 819 W 50 N
- 73 W 500 S Unit 203
- 73 W 500 S Unit 101
- 73 W 500 S Unit 304
- 73 W 500 S Unit 202
- 73 W 500 S Unit 103
- 528 W 650 S
- 553 S 100 W Unit 304
- 553 S 100 W Unit 202
- 553 S 100 W Unit 204
- 553 S 100 W Unit 104
- 553 S 100 W Unit 103
- 553 S 100 W Unit 203
- 553 S 100 W Unit 101