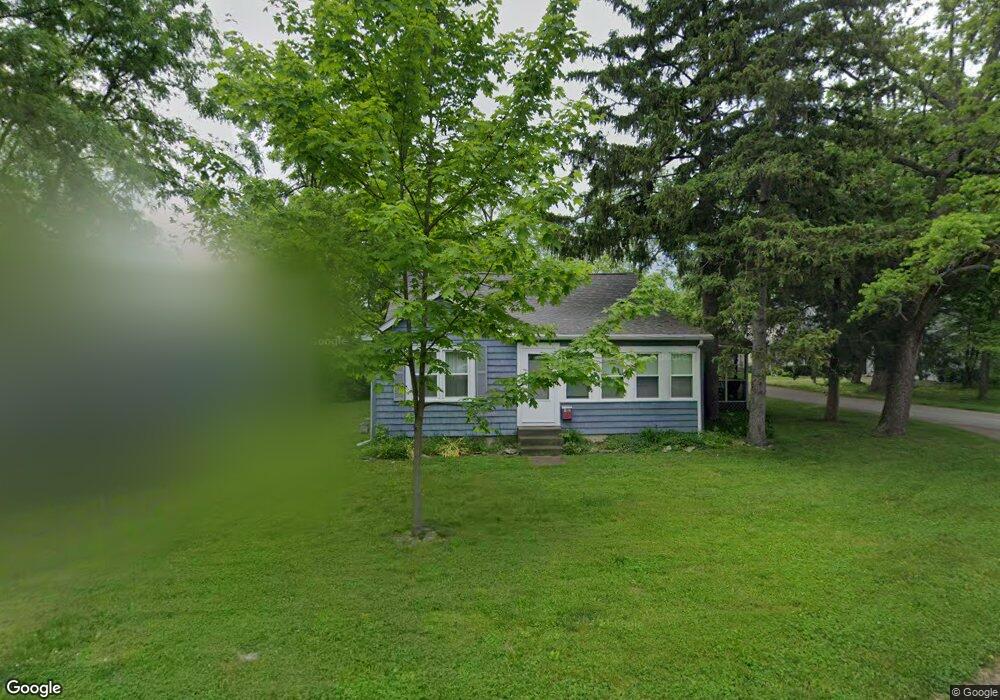
408 W 7th St Lakeside Marblehead, OH 43440
Estimated Value: $540,000 - $774,000
2
Beds
1
Bath
1,830
Sq Ft
$356/Sq Ft
Est. Value
About This Home
This home is located at 408 W 7th St, Lakeside Marblehead, OH 43440 and is currently estimated at $651,831, approximately $356 per square foot. 408 W 7th St is a home located in Ottawa County with nearby schools including Danbury Middle School and Danbury High School.
Ownership History
Date
Name
Owned For
Owner Type
Purchase Details
Closed on
Jun 24, 2025
Sold by
Mary E Bricker Trust and Bricker Mark L
Bought by
Mary E Bricker Legacy Trust and Bricker
Current Estimated Value
Purchase Details
Closed on
Aug 7, 2006
Sold by
Estate Of Ronald L Bricker
Bought by
Bricker Mary E and Ronald L Bricker Trust
Purchase Details
Closed on
Aug 3, 2006
Sold by
Bricker Mary E
Bought by
Bricker Mary E and Ronald L Bricker Family Trust
Create a Home Valuation Report for This Property
The Home Valuation Report is an in-depth analysis detailing your home's value as well as a comparison with similar homes in the area
Home Values in the Area
Average Home Value in this Area
Purchase History
| Date | Buyer | Sale Price | Title Company |
|---|---|---|---|
| Mary E Bricker Legacy Trust | -- | None Listed On Document | |
| Mary E Bricker Legacy Trust | -- | None Listed On Document | |
| Mary E Bricker Legacy Trust | -- | None Listed On Document | |
| Mary E Bricker Legacy Trust | -- | None Listed On Document | |
| Bricker Mary E | -- | None Available | |
| Bricker Mary E | -- | None Available |
Source: Public Records
Tax History Compared to Growth
Tax History
| Year | Tax Paid | Tax Assessment Tax Assessment Total Assessment is a certain percentage of the fair market value that is determined by local assessors to be the total taxable value of land and additions on the property. | Land | Improvement |
|---|---|---|---|---|
| 2024 | $6,253 | $183,474 | $93,149 | $90,325 |
| 2023 | $6,253 | $133,945 | $53,963 | $79,982 |
| 2022 | $4,624 | $133,945 | $53,963 | $79,982 |
| 2021 | $4,638 | $133,940 | $53,960 | $79,980 |
| 2020 | $4,199 | $114,770 | $52,910 | $61,860 |
| 2019 | $3,886 | $114,770 | $52,910 | $61,860 |
| 2018 | $4,138 | $114,770 | $52,910 | $61,860 |
| 2017 | $4,629 | $127,990 | $68,330 | $59,660 |
| 2016 | $4,585 | $127,990 | $68,330 | $59,660 |
| 2015 | $4,607 | $127,990 | $68,330 | $59,660 |
| 2014 | $2,320 | $126,020 | $68,330 | $57,690 |
| 2013 | $4,325 | $126,020 | $68,330 | $57,690 |
Source: Public Records
Map
Nearby Homes