Estimated Value: $94,000 - $236,000
4
Beds
2
Baths
3,168
Sq Ft
$53/Sq Ft
Est. Value
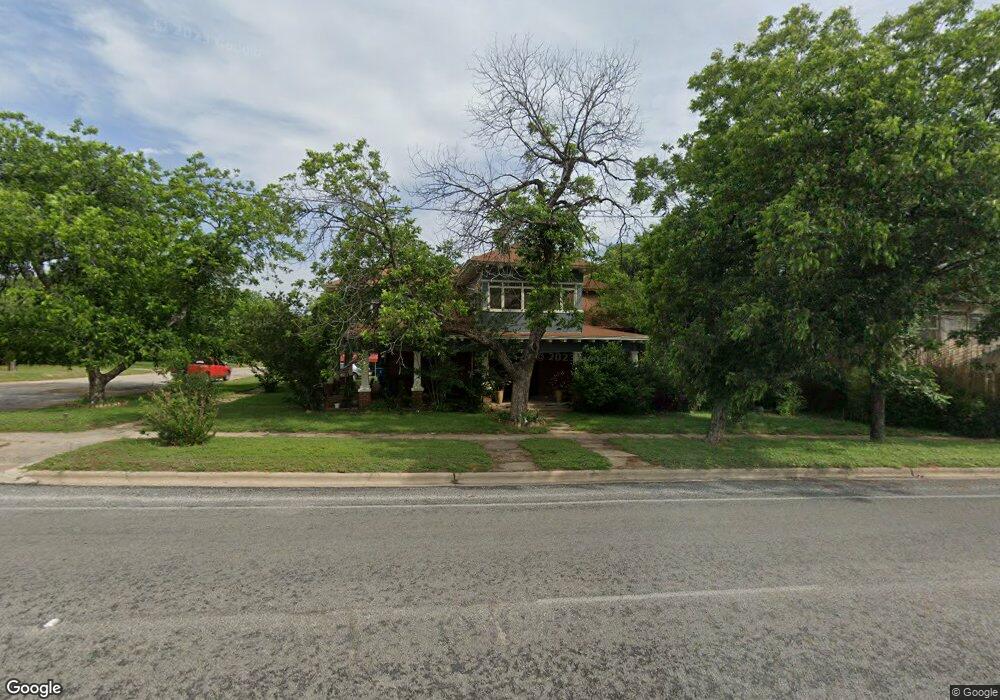
About This Home
This home is located at 408 W 8th St, Cisco, TX 76437 and is currently estimated at $169,398, approximately $53 per square foot. 408 W 8th St is a home located in Eastland County with nearby schools including Cisco Elementary School, Cisco Junior High School, and Cisco Learning Center.
Ownership History
Date
Name
Owned For
Owner Type
Purchase Details
Closed on
Mar 12, 2019
Sold by
Wester Susan
Bought by
Sellers Paul
Current Estimated Value
Home Financials for this Owner
Home Financials are based on the most recent Mortgage that was taken out on this home.
Original Mortgage
$20,000
Outstanding Balance
$17,512
Interest Rate
4.4%
Mortgage Type
Seller Take Back
Estimated Equity
$151,886
Purchase Details
Closed on
May 19, 2016
Sold by
Wester Susan
Bought by
Shaffer Rocky and Shaffer Jessica
Home Financials for this Owner
Home Financials are based on the most recent Mortgage that was taken out on this home.
Original Mortgage
$68,000
Interest Rate
3.59%
Mortgage Type
Seller Take Back
Create a Home Valuation Report for This Property
The Home Valuation Report is an in-depth analysis detailing your home's value as well as a comparison with similar homes in the area
Home Values in the Area
Average Home Value in this Area
Purchase History
| Date | Buyer | Sale Price | Title Company |
|---|---|---|---|
| Sellers Paul | -- | None Available | |
| Shaffer Rocky | -- | None Available |
Source: Public Records
Mortgage History
| Date | Status | Borrower | Loan Amount |
|---|---|---|---|
| Open | Sellers Paul | $20,000 | |
| Previous Owner | Shaffer Rocky | $68,000 |
Source: Public Records
Tax History
| Year | Tax Paid | Tax Assessment Tax Assessment Total Assessment is a certain percentage of the fair market value that is determined by local assessors to be the total taxable value of land and additions on the property. | Land | Improvement |
|---|---|---|---|---|
| 2025 | $2,256 | $128,170 | $17,000 | $111,170 |
| 2024 | $2,411 | $128,250 | $17,000 | $111,250 |
| 2023 | $2,009 | $101,100 | $5,000 | $96,100 |
| 2022 | $2,117 | $101,120 | $5,000 | $96,120 |
| 2021 | $2,014 | $85,480 | $5,000 | $80,480 |
| 2020 | $1,184 | $51,040 | $5,000 | $46,040 |
| 2019 | $1,219 | $51,040 | $5,000 | $46,040 |
| 2018 | $3,472 | $125,280 | $5,000 | $120,280 |
| 2017 | $2,366 | $104,030 | $5,000 | $99,030 |
| 2016 | $2,366 | $104,030 | $5,000 | $99,030 |
| 2015 | -- | $100,750 | $5,000 | $95,750 |
| 2014 | -- | $92,370 | $5,000 | $87,370 |
Source: Public Records
Map
Nearby Homes
Your Personal Tour Guide
Ask me questions while you tour the home.