T
Landlord's Agent in 2018
Tracey Chen
Open House Atlanta Property Management
(404) 493-0861
2 Total Sales
Estimated Value: $423,000 - $464,000
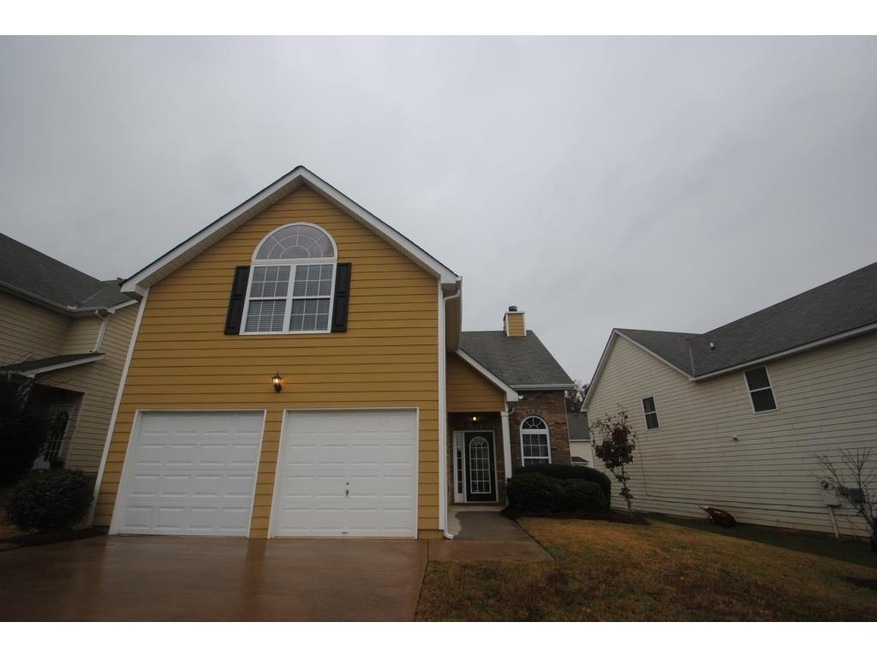
This is one of those special homes where memories are made. Attractive and renewed, this home illustrates great curb appeal with beautiful landscaping and spacious outdoor yard space. The interior features a lovely fireplace, trey ceilings, ceiling fans, beautiful hardwood and tile floors and bright and airy rooms. The kitchen boasts stainless steel appliances, beautiful dark wood cabinets and granite counter tops. Throughout the home, there is fresh paint, tile and carpet. We have many beautiful, high-quality homes.
Last Agent to Rent the Property
Open House Atlanta Property Management License #232038 Listed on: 12/03/2017
Last Renter's Agent
Open House Atlanta Property Management License #232038 Listed on: 12/03/2017
| Date | Buyer | Sale Price | Title Company |
|---|---|---|---|
| Ih6 Property Georgia Lp | $189,000 | -- | |
| Abney Lindsey M | $190,200 | -- |
| Date | Event | Price | List to Sale | Price per Sq Ft |
|---|---|---|---|---|
| 03/27/2018 03/27/18 | Rented | $1,492 | 0.0% | -- |
| 02/22/2018 02/22/18 | Under Contract | -- | -- | -- |
| 02/06/2018 02/06/18 | Price Changed | $1,492 | -0.6% | $1 / Sq Ft |
| 01/22/2018 01/22/18 | Price Changed | $1,501 | -0.6% | $1 / Sq Ft |
| 12/28/2017 12/28/17 | Price Changed | $1,510 | -1.3% | $1 / Sq Ft |
| 12/07/2017 12/07/17 | Price Changed | $1,530 | -1.3% | $1 / Sq Ft |
| 12/03/2017 12/03/17 | For Rent | $1,550 | 0.0% | -- |
| 10/05/2016 10/05/16 | Rented | $1,550 | 0.0% | -- |
| 09/15/2016 09/15/16 | Under Contract | -- | -- | -- |
| 09/14/2016 09/14/16 | Price Changed | $1,550 | -2.2% | -- |
| 09/11/2016 09/11/16 | Price Changed | $1,585 | -0.9% | -- |
| 09/07/2016 09/07/16 | Price Changed | $1,600 | -0.9% | -- |
| 09/01/2016 09/01/16 | Price Changed | $1,615 | -0.6% | -- |
| 08/23/2016 08/23/16 | Price Changed | $1,625 | -3.0% | -- |
| 08/08/2016 08/08/16 | For Rent | $1,675 | -- | -- |
| Year | Tax Paid | Tax Assessment Tax Assessment Total Assessment is a certain percentage of the fair market value that is determined by local assessors to be the total taxable value of land and additions on the property. | Land | Improvement |
|---|---|---|---|---|
| 2025 | $4,148 | $166,632 | $54,000 | $112,632 |
| 2024 | $4,148 | $169,520 | $54,000 | $115,520 |
| 2023 | $3,679 | $149,476 | $40,000 | $109,476 |
| 2022 | $3,126 | $97,984 | $20,000 | $77,984 |
| 2021 | $2,706 | $97,984 | $20,000 | $77,984 |
| 2020 | $2,511 | $90,920 | $20,000 | $70,920 |
| 2019 | $2,483 | $89,776 | $20,000 | $69,776 |
| 2018 | $2,349 | $84,948 | $18,000 | $66,948 |
| 2017 | $2,098 | $75,600 | $18,200 | $57,400 |
| 2016 | $1,836 | $71,352 | $17,200 | $54,152 |
| 2015 | $1,797 | $69,352 | $0 | $0 |
| 2014 | $1,568 | $62,504 | $0 | $0 |
T
Landlord's Agent in 2018
Tracey Chen
Open House Atlanta Property Management
(404) 493-0861
2 Total Sales

Seller's Agent in 2016
KAREN HOLLINS
CCG Realty Group, LLC.
(678) 910-5129
24 in this area
156 Total Sales
Source: First Multiple Listing Service (FMLS)
MLS Number: 5939279
APN: 217-328
![]() Listings identified with the FMLS IDX logo come from FMLS and are held by brokerage firms other than the owner of this website. The listing brokerage is identified in any listing details. Information is deemed reliable but is not guaranteed. If you believe any FMLS listing contains material that infringes your copyrighted work please visit www.fmls.com/dmca to review our DMCA policy and learn how to submit a takedown request. © 2025 First Multiple Listing Service, Inc.
Listings identified with the FMLS IDX logo come from FMLS and are held by brokerage firms other than the owner of this website. The listing brokerage is identified in any listing details. Information is deemed reliable but is not guaranteed. If you believe any FMLS listing contains material that infringes your copyrighted work please visit www.fmls.com/dmca to review our DMCA policy and learn how to submit a takedown request. © 2025 First Multiple Listing Service, Inc.
Disclaimer: Certain information contained herein is derived from information provided by parties other than Homes.com. All information provided is deemed reliable, but is not guaranteed to be accurate and should be independently verified.