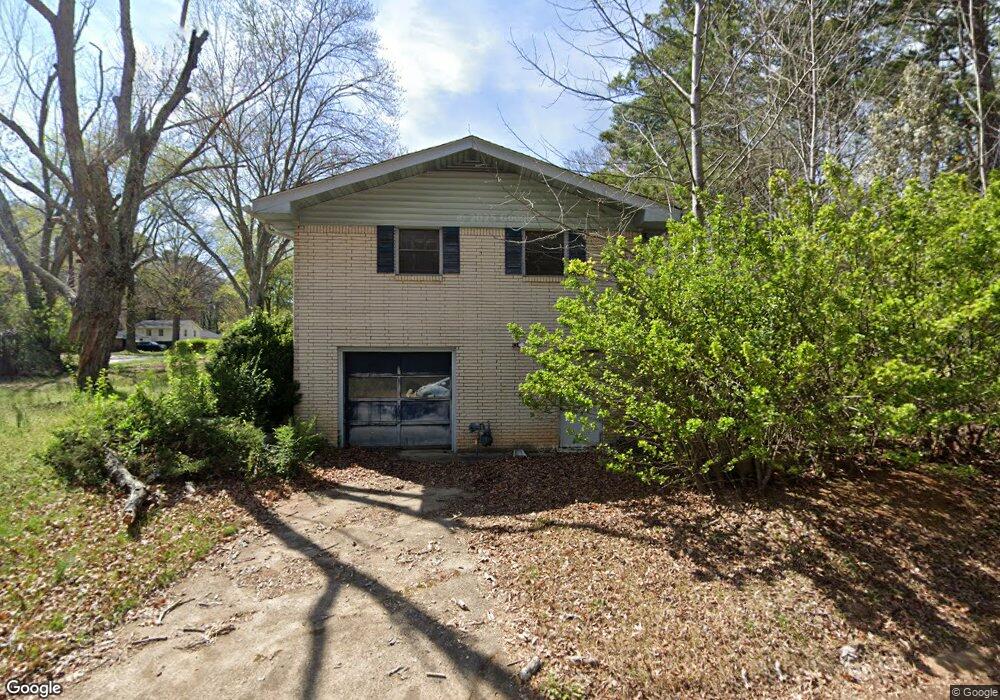
4080 Cedar Ridge Rd Powder Springs, GA 30127
Estimated Value: $314,000 - $367,948
2
Beds
2
Baths
1,955
Sq Ft
$172/Sq Ft
Est. Value
About This Home
This home is located at 4080 Cedar Ridge Rd, Powder Springs, GA 30127 and is currently estimated at $336,987, approximately $172 per square foot. 4080 Cedar Ridge Rd is a home located in Cobb County with nearby schools including Compton Elementary School, Tapp Middle School, and McEachern High School.
Ownership History
Date
Name
Owned For
Owner Type
Purchase Details
Closed on
Oct 16, 2009
Sold by
Federal Home Loan Mortgage Corporation
Bought by
Lyle David E
Current Estimated Value
Home Financials for this Owner
Home Financials are based on the most recent Mortgage that was taken out on this home.
Original Mortgage
$40,000
Outstanding Balance
$25,960
Interest Rate
5.04%
Mortgage Type
New Conventional
Estimated Equity
$311,027
Purchase Details
Closed on
Jun 2, 2009
Sold by
Gmac Mortgage Llc
Bought by
Federal Home Loan Mortgage Corporation
Purchase Details
Closed on
Sep 28, 1993
Sold by
Roemer Thomas E Nancy I
Bought by
Hoadley Dennis A Jody D
Home Financials for this Owner
Home Financials are based on the most recent Mortgage that was taken out on this home.
Original Mortgage
$90,000
Interest Rate
6.97%
Mortgage Type
VA
Create a Home Valuation Report for This Property
The Home Valuation Report is an in-depth analysis detailing your home's value as well as a comparison with similar homes in the area
Home Values in the Area
Average Home Value in this Area
Purchase History
| Date | Buyer | Sale Price | Title Company |
|---|---|---|---|
| Lyle David E | $65,000 | -- | |
| Federal Home Loan Mortgage Corporation | -- | -- | |
| Gmac Mortgage Llc | $127,522 | -- | |
| Hoadley Dennis A Jody D | $90,000 | -- |
Source: Public Records
Mortgage History
| Date | Status | Borrower | Loan Amount |
|---|---|---|---|
| Open | Lyle David E | $40,000 | |
| Previous Owner | Hoadley Dennis A Jody D | $90,000 |
Source: Public Records
Tax History Compared to Growth
Tax History
| Year | Tax Paid | Tax Assessment Tax Assessment Total Assessment is a certain percentage of the fair market value that is determined by local assessors to be the total taxable value of land and additions on the property. | Land | Improvement |
|---|---|---|---|---|
| 2025 | $3,904 | $129,584 | $24,000 | $105,584 |
| 2024 | $3,873 | $128,456 | $15,200 | $113,256 |
| 2023 | $3,873 | $128,456 | $15,200 | $113,256 |
| 2022 | $3,280 | $108,076 | $15,200 | $92,876 |
| 2021 | $2,329 | $76,724 | $15,200 | $61,524 |
| 2020 | $1,737 | $57,232 | $14,000 | $43,232 |
| 2019 | $1,737 | $57,232 | $14,000 | $43,232 |
| 2018 | $1,737 | $57,232 | $14,000 | $43,232 |
| 2017 | $1,512 | $52,588 | $8,000 | $44,588 |
| 2016 | $1,087 | $37,824 | $8,000 | $29,824 |
| 2015 | $868 | $29,452 | $6,000 | $23,452 |
| 2014 | $875 | $29,452 | $0 | $0 |
Source: Public Records
Map
Nearby Homes
- 4021 Evelyn Dr
- 3967 Evelyn Dr
- 3215 Dogwood Dr
- 3927 Buck Rd
- 3792 Villa Springs Cir Unit 54
- 3309 Dilmus Dr
- 3314 Dilmus Dr
- 803 New Horizon St
- Morgan Plan at Concord Oaks
- Monterey Plan at Concord Oaks
- Norwood Plan at Concord Oaks
- 1201 New Horizon St
- 3212 Winding Waters Way Unit 24
- 3212 Winding Waters Way Unit 22
- 3204 Winding Waters Way Unit 20
- 4150 Wax Myrtle Way Unit 19
- 4154 Wax Myrtle Way Unit 18
- 3224 Winding Waters Way
- 3212 Winding Waters Way
- 3220 Winding Waters Way
- 4090 Cedar Ridge Rd
- 3390 Dogwood Dr
- 3375 Dogwood Dr
- 3380 Dogwood Dr
- 4100 Cedar Ridge Rd
- 4081 Cedar Ridge Rd
- 4091 Cedar Ridge Rd
- 4101 Cedar Ridge Rd
- 4095 Poplar Trail
- 3370 Dogwood Dr
- 4110 Cedar Ridge Rd
- 4085 Poplar Trail
- 4105 Poplar Trail
- 3360 Dogwood Dr
- 4111 Cedar Ridge Rd
- 4004 Evelyn Dr
- 4002 Evelyn Dr Unit 4
- 0 Cedar Ridge Rd Unit 54
- 3495 Dogwood Dr
- 4120 Cedar Ridge Rd