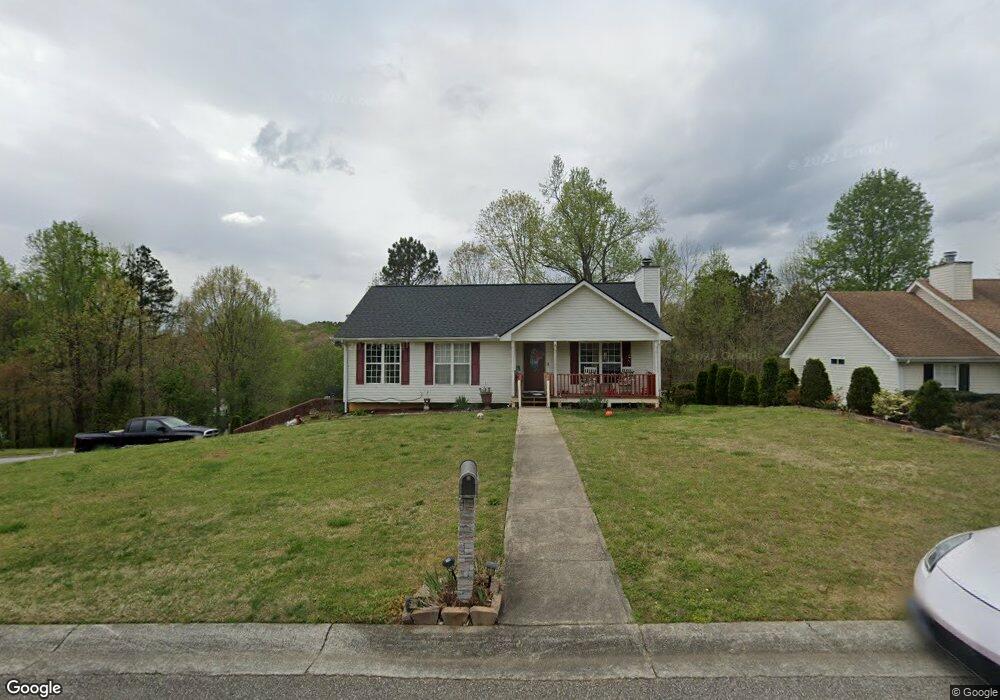
4080 Parks Rd Flowery Branch, GA 30542
Estimated Value: $299,494 - $346,000
3
Beds
2
Baths
1,184
Sq Ft
$273/Sq Ft
Est. Value
About This Home
This home is located at 4080 Parks Rd, Flowery Branch, GA 30542 and is currently estimated at $323,624, approximately $273 per square foot. 4080 Parks Rd is a home located in Hall County with nearby schools including Martin Elementary School, Southwest Middle School, and C.W. Davis Middle School.
Ownership History
Date
Name
Owned For
Owner Type
Purchase Details
Closed on
Jul 18, 2011
Sold by
Hud-Housing Of Urban Dev
Bought by
Bonilla Karina
Current Estimated Value
Home Financials for this Owner
Home Financials are based on the most recent Mortgage that was taken out on this home.
Original Mortgage
$76,037
Outstanding Balance
$53,191
Interest Rate
4.87%
Mortgage Type
FHA
Estimated Equity
$270,433
Purchase Details
Closed on
Jan 4, 2011
Sold by
Everbank
Bought by
Hud-Housing Of Urban Dev
Purchase Details
Closed on
Sep 5, 2003
Sold by
Sweeney Tanya D
Bought by
Demming Kendrick
Home Financials for this Owner
Home Financials are based on the most recent Mortgage that was taken out on this home.
Original Mortgage
$134,437
Interest Rate
6.13%
Mortgage Type
FHA
Purchase Details
Closed on
Nov 25, 1997
Sold by
Sunrise Home Builders Inc
Bought by
Sweeney Tanya D
Purchase Details
Closed on
Oct 17, 1997
Sold by
Zonnenberg Martin B P
Bought by
Sunrise Home Builders Inc
Create a Home Valuation Report for This Property
The Home Valuation Report is an in-depth analysis detailing your home's value as well as a comparison with similar homes in the area
Home Values in the Area
Average Home Value in this Area
Purchase History
| Date | Buyer | Sale Price | Title Company |
|---|---|---|---|
| Bonilla Karina | -- | -- | |
| Hud-Housing Of Urban Dev | -- | -- | |
| Everbank | $132,969 | -- | |
| Demming Kendrick | $135,500 | -- | |
| Sweeney Tanya D | $96,800 | -- | |
| Sunrise Home Builders Inc | $31,000 | -- |
Source: Public Records
Mortgage History
| Date | Status | Borrower | Loan Amount |
|---|---|---|---|
| Open | Bonilla Karina | $76,037 | |
| Previous Owner | Demming Kendrick | $134,437 | |
| Closed | Sweeney Tanya D | -- |
Source: Public Records
Tax History Compared to Growth
Tax History
| Year | Tax Paid | Tax Assessment Tax Assessment Total Assessment is a certain percentage of the fair market value that is determined by local assessors to be the total taxable value of land and additions on the property. | Land | Improvement |
|---|---|---|---|---|
| 2024 | $2,800 | $108,360 | $15,800 | $92,560 |
| 2023 | $2,816 | $109,160 | $15,800 | $93,360 |
| 2022 | $2,509 | $92,800 | $14,360 | $78,440 |
| 2021 | $2,201 | $79,320 | $9,240 | $70,080 |
| 2020 | $1,897 | $65,800 | $7,640 | $58,160 |
| 2019 | $1,708 | $58,360 | $7,640 | $50,720 |
| 2018 | $1,553 | $50,880 | $7,640 | $43,240 |
| 2017 | $1,420 | $46,680 | $7,640 | $39,040 |
| 2016 | $1,203 | $39,840 | $7,640 | $32,200 |
| 2015 | $935 | $29,789 | $4,560 | $25,229 |
| 2014 | $935 | $29,789 | $4,560 | $25,229 |
Source: Public Records
Map
Nearby Homes
- 4086 Parks Rd
- 4020 Parks Rd
- 4684 Martins Crossing Dr W
- 4021 Laurant Path
- 4013 Laurant Path
- 4016 Laurant Path
- 4054 Alderstone Dr
- 4042 Alderstone Dr
- 4050 Alderstone Dr
- 4003 Warren Rd
- Wakehurst Plan at Falls Creek
- 3935 Alderstone Dr
- Sheridan Plan at Falls Creek
- Avera Plan at Falls Creek
- Atwood Plan at Falls Creek
- Trenton Plan at Falls Creek
- Prescott Plan at Falls Creek
- Ingram Plan at Falls Creek
- Fairfield Plan at Falls Creek
- Denton Plan at Falls Creek