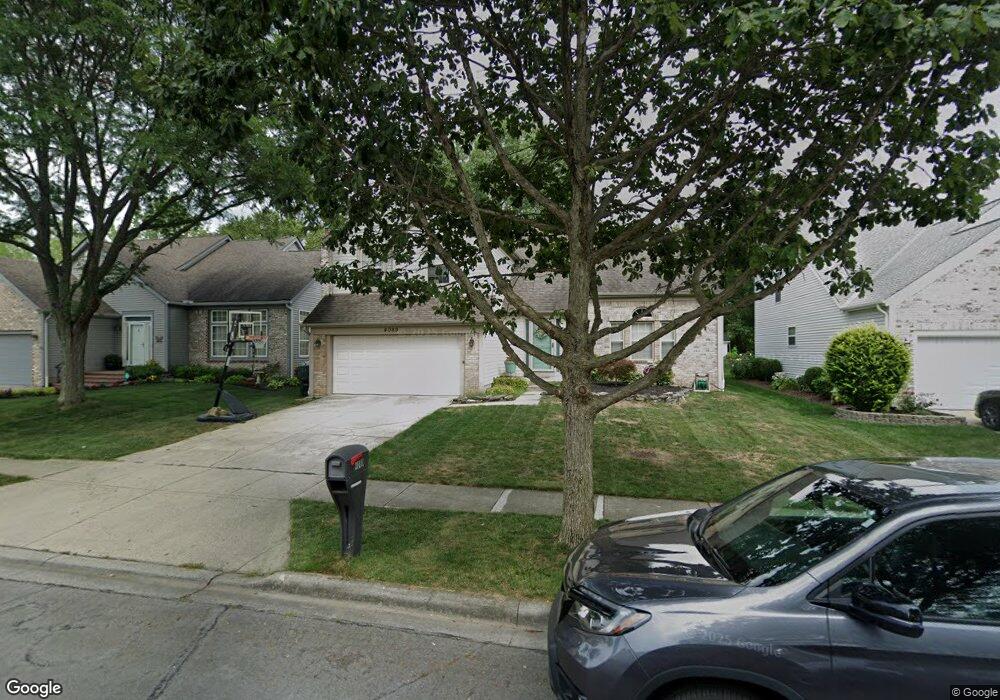
4080 Pathfield Dr Columbus, OH 43230
Preserve South NeighborhoodEstimated Value: $391,951 - $516,000
3
Beds
3
Baths
2,262
Sq Ft
$204/Sq Ft
Est. Value
About This Home
This home is located at 4080 Pathfield Dr, Columbus, OH 43230 and is currently estimated at $460,988, approximately $203 per square foot. 4080 Pathfield Dr is a home located in Franklin County with nearby schools including New Albany Primary School, New Albany Intermediate School, and New Albany Middle School.
Ownership History
Date
Name
Owned For
Owner Type
Purchase Details
Closed on
Nov 3, 2011
Sold by
Bodman Elyse R
Bought by
Nasrallah Joshua G and Clouse Stephanie D
Current Estimated Value
Home Financials for this Owner
Home Financials are based on the most recent Mortgage that was taken out on this home.
Original Mortgage
$194,900
Outstanding Balance
$131,397
Interest Rate
4.09%
Mortgage Type
Future Advance Clause Open End Mortgage
Estimated Equity
$329,591
Purchase Details
Closed on
Oct 15, 2010
Sold by
Bodman Joshua A
Bought by
Bodman Elyse R
Purchase Details
Closed on
Oct 26, 2005
Sold by
Perkins Thomas W and Perkins Joy L
Bought by
Bodman Joshua A and Bodman Elyse R
Home Financials for this Owner
Home Financials are based on the most recent Mortgage that was taken out on this home.
Original Mortgage
$168,520
Interest Rate
5.8%
Mortgage Type
Fannie Mae Freddie Mac
Purchase Details
Closed on
Mar 28, 1994
Bought by
Perkins Thomas W and Perkins Joy L
Purchase Details
Closed on
Oct 22, 1993
Create a Home Valuation Report for This Property
The Home Valuation Report is an in-depth analysis detailing your home's value as well as a comparison with similar homes in the area
Home Values in the Area
Average Home Value in this Area
Purchase History
| Date | Buyer | Sale Price | Title Company |
|---|---|---|---|
| Nasrallah Joshua G | $209,000 | Arrow Title Agency Llc | |
| Bodman Elyse R | -- | None Available | |
| Bodman Joshua A | $211,900 | Trinity Tit | |
| Perkins Thomas W | $156,000 | -- | |
| -- | -- | -- |
Source: Public Records
Mortgage History
| Date | Status | Borrower | Loan Amount |
|---|---|---|---|
| Open | Nasrallah Joshua G | $194,900 | |
| Closed | Bodman Joshua A | $168,520 |
Source: Public Records
Tax History
| Year | Tax Paid | Tax Assessment Tax Assessment Total Assessment is a certain percentage of the fair market value that is determined by local assessors to be the total taxable value of land and additions on the property. | Land | Improvement |
|---|---|---|---|---|
| 2025 | $6,180 | $113,650 | $20,480 | $93,170 |
| 2024 | $6,180 | $113,650 | $20,480 | $93,170 |
| 2023 | $5,971 | $113,645 | $20,475 | $93,170 |
| 2022 | $6,908 | $101,860 | $23,770 | $78,090 |
| 2021 | $6,611 | $101,860 | $23,770 | $78,090 |
| 2020 | $6,566 | $101,860 | $23,770 | $78,090 |
| 2019 | $5,911 | $83,720 | $19,810 | $63,910 |
| 2018 | $5,434 | $83,720 | $19,810 | $63,910 |
| 2017 | $5,912 | $83,720 | $19,810 | $63,910 |
| 2016 | $5,047 | $65,840 | $11,200 | $54,640 |
| 2015 | $5,042 | $65,840 | $11,200 | $54,640 |
| 2014 | $5,071 | $65,840 | $11,200 | $54,640 |
| 2013 | $2,476 | $62,720 | $10,675 | $52,045 |
Source: Public Records
Map
Nearby Homes
- 4050 Summerstone Dr
- 6191 Joes Hopper Rd Unit 73
- 4154 Windbud Dr Unit 10
- 3826 Wood Stork Ln Unit 68
- 6032 Willingford Ln Unit 9
- 6185 Needletail Rd Unit 64
- 3753 Brightwell Ln
- 4185 Windsor Bridge Place Unit 44185
- 6242 Needletail Rd Unit 33
- 4183 Windsor Bridge Place Unit 44183
- 3863 Preserve Crossing Blvd Unit 47
- 3665 Fish Hawk Landing
- 4304 Bridgeside Place
- 4331 Bridgeside Place Unit 18
- 622 Piney Glen Dr
- 536 Calkin Ln E Unit 23
- 4625 Wenham Park Unit 11
- 4651 E Johnstown Rd
- 4063 Parkcove Dr Unit 21A
- 4081 Chennin Dr Unit 2
- 4072 Pathfield Dr
- 4088 Pathfield Dr
- 4066 Pathfield Dr
- 4094 Pathfield Dr
- 4081 Pathfield Dr
- 4095 Pathfield Dr
- 4060 Pathfield Dr
- 3989 Summerstone Dr
- 3977 Summerstone Dr
- 4100 Pathfield Dr
- 4107 Pathfield Dr
- 4067 Pathfield Dr
- 3971 Summerstone Dr
- 4054 Pathfield Dr
- 4106 Pathfield Dr
- 4013 Summerstone Dr
- 3965 Summerstone Dr
- 6158 Headington Place
- 3995 Summerstone Dr
- 4059 Pathfield Dr
Your Personal Tour Guide
Ask me questions while you tour the home.