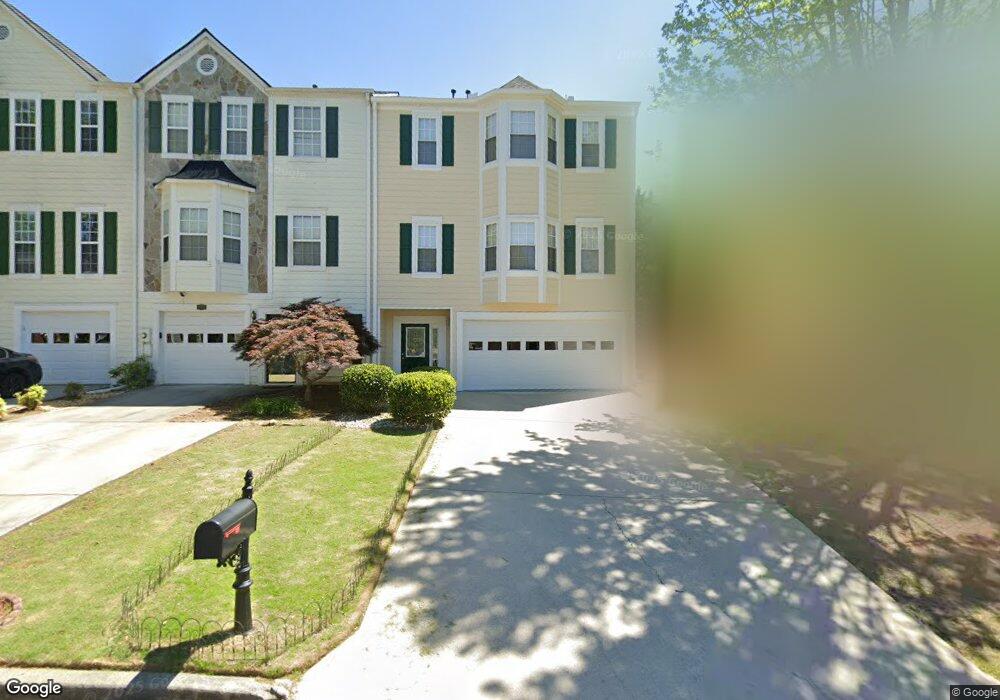
4080 Spring Cove Dr Unit 2 Duluth, GA 30097
Estimated Value: $331,000 - $362,000
About This Home
This home is located at 4080 Spring Cove Dr Unit 2, Duluth, GA 30097 and is currently estimated at $344,765, approximately $206 per square foot. 4080 Spring Cove Dr Unit 2 is a home located in Gwinnett County with nearby schools including Chattahoochee Elementary School, Coleman Middle School, and Duluth High School.
Ownership History
We collect this data history from publicly available records. To have your information removed, we recommend requesting removal directly through your county’s website.
Purchase Details
Home Financials for this Owner
Home Financials are based on the most recent Mortgage that was taken out on this home.Purchase Details
Home Financials for this Owner
Home Financials are based on the most recent Mortgage that was taken out on this home.Purchase Details
Home Financials for this Owner
Home Financials are based on the most recent Mortgage that was taken out on this home.Home Values in the Area
Average Home Value in this Area
Purchase History
We collect this data history from publicly available records. To have your information removed, we recommend requesting removal directly through your county’s website.
| Date | Buyer | Sale Price | Title Company |
|---|---|---|---|
| $140,000 | -- | ||
| $146,000 | -- | ||
| $118,600 | -- |
Mortgage History
We collect this data history from publicly available records. To have your information removed, we recommend requesting removal directly through your county’s website.
| Date | Status | Borrower | Loan Amount |
|---|---|---|---|
| Previous Owner | $137,750 | ||
| Previous Owner | $144,050 | ||
| Previous Owner | $78,000 |
Tax History
We collect this data history from publicly available records. To have your information removed, we recommend requesting removal directly through your county’s website.
| Year | Tax Paid | Tax Assessment Tax Assessment Total Assessment is a certain percentage of the fair market value that is determined by local assessors to be the total taxable value of land and additions on the property. | Land | Improvement |
|---|---|---|---|---|
| 2025 | $3,614 | $161,560 | $18,040 | $143,520 |
| 2024 | $3,441 | $146,400 | $16,000 | $130,400 |
| 2023 | $3,441 | $143,080 | $16,000 | $127,080 |
| 2022 | $3,075 | $128,000 | $16,000 | $112,000 |
| 2021 | $2,454 | $94,800 | $11,600 | $83,200 |
| 2020 | $2,280 | $85,640 | $11,600 | $74,040 |
| 2019 | $3,123 | $92,440 | $11,600 | $80,840 |
| 2018 | $2,242 | $79,960 | $11,600 | $68,360 |
| 2016 | $1,911 | $64,680 | $11,600 | $53,080 |
| 2015 | $1,916 | $53,240 | $8,800 | $44,440 |
| 2014 | -- | $53,240 | $8,800 | $44,440 |
Map
- 4089 Spring Cove Dr
- 4120 Spring Cove Dr
- 2491 Valley Cove Dr
- 2555 Summit Cove Dr
- 4005 Spring Cove Dr
- 4245 Prince Charles Dr
- 2564 Niblick Way
- 4105 Cavalier Way
- 4044 Bennigan Ln Unit 3
- 2852 Girard Ln
- 3915 Cavalier Way
- 4195 Longlake Dr
- 3980 Longlake Dr
- 3955 Longlake Dr
- 3855 Ruby Falls Dr Unit III
- 3886 Toccoa Falls Dr
- 2372 Tallapoosa Dr
- 2711 Old Coach Rd
- 2163 Soque River Dr
- 4053 Towne Creek Cove
- 4091 Spring Cove Dr
- 4085 Spring Cove Dr
- 4081 Spring Cove Dr
- 4095 Spring Cove Dr
- 4099 Spring Cove Dr Unit 50
- 0 Spring Cove Dr Unit 8826027
- 4079 Spring Cove Dr
- 4105 Spring Cove Dr
- 4075 Spring Cove Dr Unit 4073
- 4075 Spring Cove Dr Unit 57
- 4075 Spring Cove Dr Unit 4075
- 4075 Spring Cove Dr
- 2504 Summit Cove Dr
- 4078 Spring Cove Dr Unit 94
- 4109 Spring Cove Dr
- 4071 Spring Cove Dr
- 2456 Valley Cove Dr
- 2436 Valley Cove Dr
- 2454 Valley Cove Dr Unit 42
- 2462 Valley Cove Dr
Ask me questions while you tour the home.