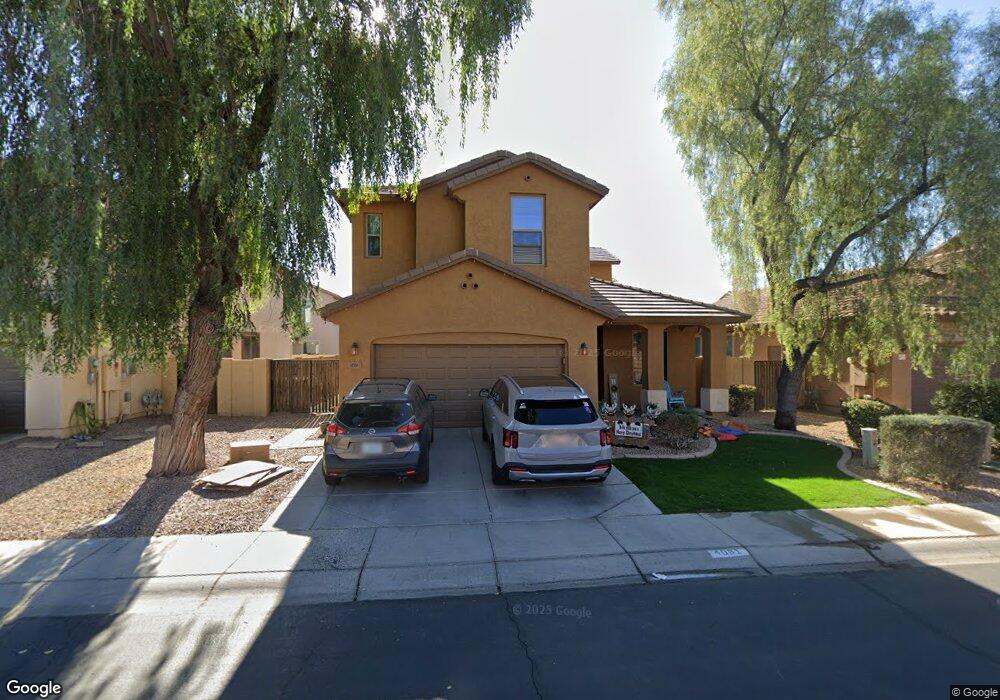
4081 E Torrey Pines Ln Chandler, AZ 85249
Sun Groves NeighborhoodEstimated Value: $494,335 - $550,000
3
Beds
3
Baths
2,336
Sq Ft
$223/Sq Ft
Est. Value
About This Home
This home is located at 4081 E Torrey Pines Ln, Chandler, AZ 85249 and is currently estimated at $521,584, approximately $223 per square foot. 4081 E Torrey Pines Ln is a home located in Maricopa County with nearby schools including Navarrete Elementary School, Willie & Coy Payne Jr. High School, and Montessori Christian Academy.
Ownership History
Date
Name
Owned For
Owner Type
Purchase Details
Closed on
Feb 12, 2013
Sold by
Lion Jeffrey A
Bought by
Jl Diversified Llc
Current Estimated Value
Purchase Details
Closed on
Jan 24, 2011
Sold by
Fannie Mae
Bought by
Lion Jeff and Lion Ingrid
Purchase Details
Closed on
Oct 28, 2010
Sold by
Herrmann John and Herrmann Mary M
Bought by
Federal National Mortgage Association
Purchase Details
Closed on
Aug 16, 2007
Sold by
Elite Homes Inc
Bought by
Herrmann John and Hermann Mary M
Home Financials for this Owner
Home Financials are based on the most recent Mortgage that was taken out on this home.
Original Mortgage
$281,000
Interest Rate
6.05%
Mortgage Type
New Conventional
Create a Home Valuation Report for This Property
The Home Valuation Report is an in-depth analysis detailing your home's value as well as a comparison with similar homes in the area
Home Values in the Area
Average Home Value in this Area
Purchase History
| Date | Buyer | Sale Price | Title Company |
|---|---|---|---|
| Jl Diversified Llc | -- | None Available | |
| Lion Jeff | $171,900 | Old Republic Title Agency | |
| Federal National Mortgage Association | $263,978 | None Available | |
| Herrmann John | $312,247 | First American Title Ins Co | |
| Elite Homes Inc | -- | First American Title Ins Co |
Source: Public Records
Mortgage History
| Date | Status | Borrower | Loan Amount |
|---|---|---|---|
| Previous Owner | Herrmann John | $281,000 |
Source: Public Records
Tax History Compared to Growth
Tax History
| Year | Tax Paid | Tax Assessment Tax Assessment Total Assessment is a certain percentage of the fair market value that is determined by local assessors to be the total taxable value of land and additions on the property. | Land | Improvement |
|---|---|---|---|---|
| 2025 | $2,467 | $26,170 | -- | -- |
| 2024 | $2,382 | $24,924 | -- | -- |
| 2023 | $2,382 | $37,570 | $7,510 | $30,060 |
| 2022 | $2,307 | $28,310 | $5,660 | $22,650 |
| 2021 | $2,368 | $26,010 | $5,200 | $20,810 |
| 2020 | $2,354 | $24,820 | $4,960 | $19,860 |
| 2019 | $2,272 | $22,900 | $4,580 | $18,320 |
| 2018 | $2,206 | $21,760 | $4,350 | $17,410 |
| 2017 | $2,074 | $20,550 | $4,110 | $16,440 |
| 2016 | $2,003 | $20,070 | $4,010 | $16,060 |
| 2015 | $1,919 | $19,500 | $3,900 | $15,600 |
Source: Public Records
Map
Nearby Homes
- 4083 E Cherry Hills Dr
- 4134 E Dawson Dr
- 3943 E Torrey Pines Ln
- 3920 E Runaway Bay Place
- 6347 S Pinaleno Place
- 5940 S Gemstone Dr
- 3879 E Gemini Place
- 5900 S Gemstone Dr
- 4310 E Gemini Place
- 5951 S White Place
- 4221 E Aquarius Place Unit 26
- 4307 E Capricorn Place Unit 19
- 4348 E Scorpio Place
- 6571 S Granite Dr
- 4327 E Capricorn Place
- 6222 S Huachuca Way
- 4525 E Runaway Bay Dr
- 6103 S Huachuca Way
- 4175 E Westchester Dr
- 3640 E Torrey Pines Ln
- 4091 E Torrey Pines Ln
- 4071 E Torrey Pines Ln
- 4082 E Cherry Hills Dr
- 4092 E Cherry Hills Dr
- 4072 E Cherry Hills Dr
- 4101 E Torrey Pines Ln
- 4070 E Torrey Pines Ln
- 4062 E Cherry Hills Dr
- 4090 E Torrey Pines Ln
- 4060 E Torrey Pines Ln
- 4100 E Torrey Pines Ln
- 4052 E Cherry Hills Dr
- 4111 E Torrey Pines Ln
- 4050 E Torrey Pines Ln
- 4041 E Torrey Pines Ln
- 4112 E Cherry Hills Dr
- 4110 E Torrey Pines Ln
- 4042 E Cherry Hills Dr
- 4073 E Cherry Hills Dr