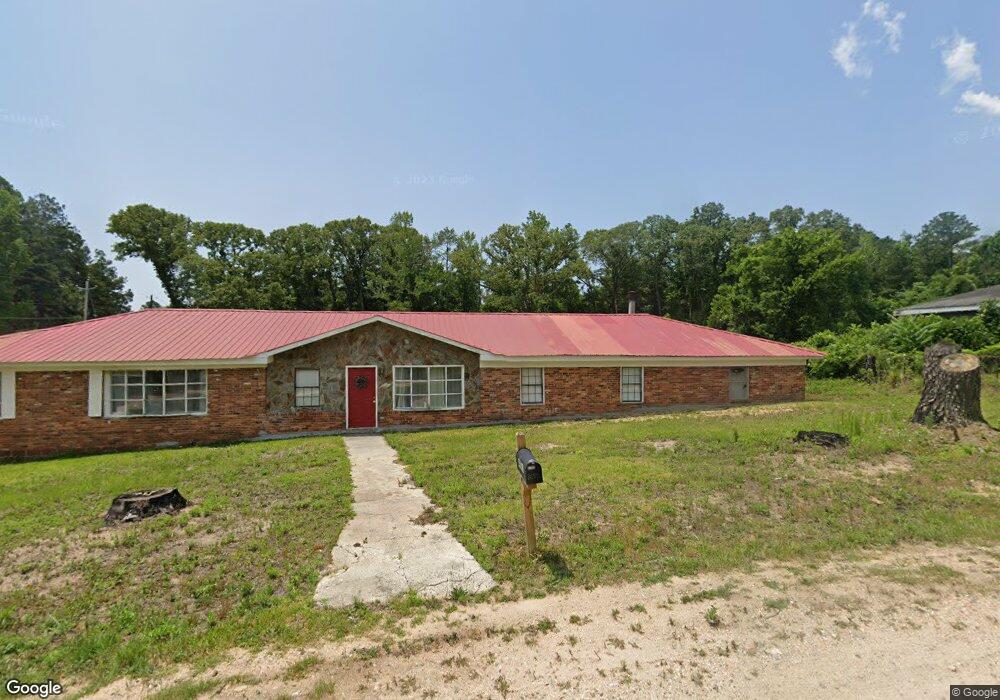
4081 Lazy Ln Macon, GA 31217
Estimated Value: $99,000 - $166,000
3
Beds
2
Baths
2,716
Sq Ft
$50/Sq Ft
Est. Value
About This Home
This home is located at 4081 Lazy Ln, Macon, GA 31217 and is currently estimated at $136,897, approximately $50 per square foot. 4081 Lazy Ln is a home with nearby schools including Bernd Elementary School, Appling Middle School, and Northeast High School.
Ownership History
Date
Name
Owned For
Owner Type
Purchase Details
Closed on
Oct 11, 2019
Sold by
Peacock Edward
Bought by
Billue Charles
Current Estimated Value
Home Financials for this Owner
Home Financials are based on the most recent Mortgage that was taken out on this home.
Original Mortgage
$28,750
Interest Rate
3.5%
Mortgage Type
Seller Take Back
Purchase Details
Closed on
Oct 7, 2008
Sold by
Billue Valerie and Billue Charles
Bought by
Peacock Edward
Purchase Details
Closed on
Jan 20, 2006
Sold by
Billue Valerie
Bought by
Billue Valerie and Billue Charles
Home Financials for this Owner
Home Financials are based on the most recent Mortgage that was taken out on this home.
Original Mortgage
$5,000
Interest Rate
6.21%
Mortgage Type
Purchase Money Mortgage
Purchase Details
Closed on
Dec 1, 2003
Purchase Details
Closed on
May 6, 2003
Create a Home Valuation Report for This Property
The Home Valuation Report is an in-depth analysis detailing your home's value as well as a comparison with similar homes in the area
Home Values in the Area
Average Home Value in this Area
Purchase History
| Date | Buyer | Sale Price | Title Company |
|---|---|---|---|
| Billue Charles | $28,750 | None Available | |
| Peacock Edward | $3,114 | None Available | |
| Billue Valerie | -- | None Available | |
| Billue Valerie | $100,000 | None Avilebel | |
| -- | $83,000 | -- | |
| -- | $25,000 | -- |
Source: Public Records
Mortgage History
| Date | Status | Borrower | Loan Amount |
|---|---|---|---|
| Closed | Billue Charles | $28,750 | |
| Previous Owner | Billue Valerie | $5,000 | |
| Previous Owner | Billue Valerie | $90,000 |
Source: Public Records
Tax History Compared to Growth
Tax History
| Year | Tax Paid | Tax Assessment Tax Assessment Total Assessment is a certain percentage of the fair market value that is determined by local assessors to be the total taxable value of land and additions on the property. | Land | Improvement |
|---|---|---|---|---|
| 2025 | -- | $43,204 | $5,520 | $37,684 |
| 2024 | -- | $43,204 | $5,520 | $37,684 |
| 2023 | $0 | $43,204 | $5,520 | $37,684 |
| 2022 | $262 | $21,454 | $3,285 | $18,169 |
| 2021 | $815 | $21,454 | $3,285 | $18,169 |
| 2020 | $446 | $21,454 | $3,285 | $18,169 |
| 2019 | $616 | $15,730 | $3,285 | $12,445 |
| 2018 | $1,123 | $15,730 | $3,285 | $12,445 |
| 2017 | $501 | $15,730 | $3,285 | $12,445 |
| 2016 | $833 | $24,074 | $3,285 | $20,788 |
| 2015 | $1,179 | $24,074 | $3,285 | $20,788 |
| 2014 | $1,181 | $24,074 | $3,285 | $20,788 |
Source: Public Records
Map
Nearby Homes
- 3917 Jeffersonville Rd
- 3909 Jeffersonville Rd
- 4401 Crystal Lake Dr
- 4121 Irwinton Rd
- 3704 Greenway Place
- 3724 Hitchcock Rd
- 3335 Esther Dr
- 3348 Kings Park Cir
- 3389 Majestic Ln
- 3434 Majestic Ct
- 3320 Jones Dr
- 3425 Majestic Ct
- 3835 Kings Park Cir
- 3982 Kings Park Cir
- 4255 Training School Rd
- 4240 Training School Rd
- 3341 Masseyville Rd
- 4065 Lazy Ln
- 3771 Harold Rd
- 3728 Harold Rd
- 4026 Jeffersonville Rd
- 4014 Jeffersonville Rd
- 4008 Jeffersonville Rd
- 4045 Jeffersonville Rd
- 3978 Jeffersonville Rd
- 4033 Jeffersonville Rd
- 4057 Jeffersonville Rd
- 4025 Jeffersonville Rd
- 3964 Jeffersonville Rd
- 4011 Jeffersonville Rd
- 3960 Jeffersonville Rd
- 3664 Harold Rd
- 4125 Jeffersonville Rd
- 3969 Jeffersonville Rd
- 3669 Harold Rd
- 3656 Harold Rd
- 3961 Jeffersonville Rd