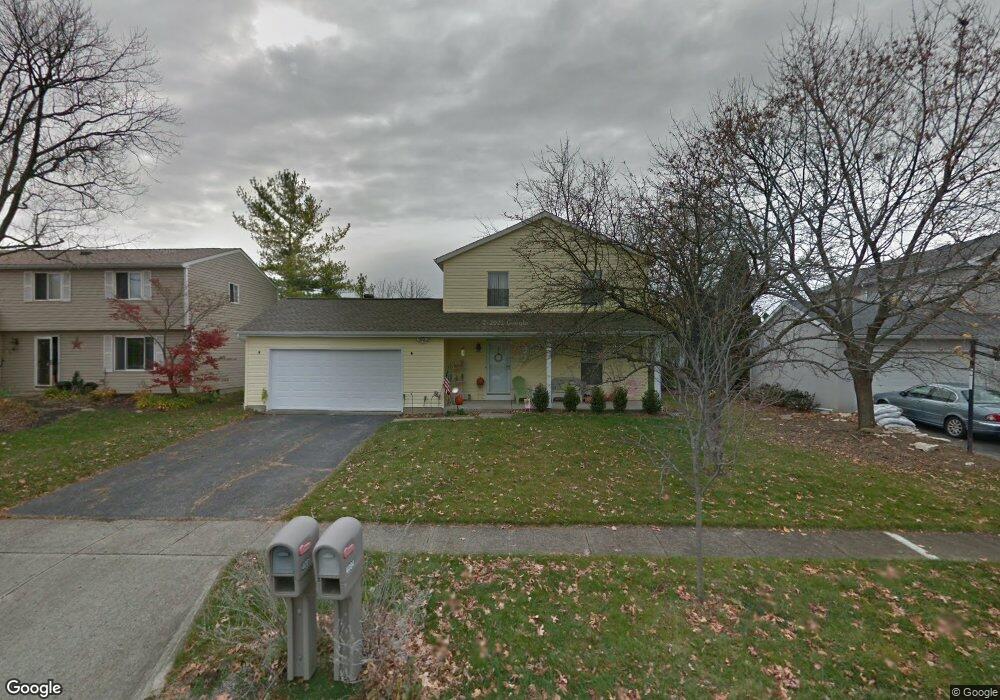
4081 Sequoia Ave Grove City, OH 43123
Estimated Value: $315,000 - $344,000
3
Beds
3
Baths
1,664
Sq Ft
$196/Sq Ft
Est. Value
About This Home
This home is located at 4081 Sequoia Ave, Grove City, OH 43123 and is currently estimated at $325,392, approximately $195 per square foot. 4081 Sequoia Ave is a home located in Franklin County with nearby schools including Holt Crossing Intermediate School, Richard Avenue Elementary School, and Central Crossing High School.
Ownership History
Date
Name
Owned For
Owner Type
Purchase Details
Closed on
Apr 22, 2010
Sold by
Regan Andrea E
Bought by
Regan Andrea E and Andrea E Regan Trust
Current Estimated Value
Purchase Details
Closed on
Jul 7, 2009
Sold by
Deutsche Bank National Trust Company
Bought by
Regan Andrea E
Home Financials for this Owner
Home Financials are based on the most recent Mortgage that was taken out on this home.
Original Mortgage
$78,551
Outstanding Balance
$51,579
Interest Rate
5.43%
Mortgage Type
FHA
Estimated Equity
$273,813
Purchase Details
Closed on
Mar 19, 2009
Sold by
Risinger Shannon M and Case #08Cve04 5636
Bought by
Deutsche Bank National Trust Company
Purchase Details
Closed on
Sep 5, 2003
Sold by
Ryan Michael T and Ryan Kathleen A
Bought by
Risinger Shannon M and Risinger Rudy L
Purchase Details
Closed on
Jun 29, 1990
Bought by
Ryan Michael T
Purchase Details
Closed on
Apr 1, 1988
Purchase Details
Closed on
Nov 1, 1978
Create a Home Valuation Report for This Property
The Home Valuation Report is an in-depth analysis detailing your home's value as well as a comparison with similar homes in the area
Home Values in the Area
Average Home Value in this Area
Purchase History
| Date | Buyer | Sale Price | Title Company |
|---|---|---|---|
| Regan Andrea E | -- | None Available | |
| Regan Andrea E | $80,000 | None Available | |
| Deutsche Bank National Trust Company | $90,000 | First American Title Ins Co | |
| Risinger Shannon M | $127,000 | Christopher Land Title Inc | |
| Ryan Michael T | $88,500 | -- | |
| -- | -- | -- | |
| -- | $48,000 | -- |
Source: Public Records
Mortgage History
| Date | Status | Borrower | Loan Amount |
|---|---|---|---|
| Open | Regan Andrea E | $78,551 |
Source: Public Records
Tax History Compared to Growth
Tax History
| Year | Tax Paid | Tax Assessment Tax Assessment Total Assessment is a certain percentage of the fair market value that is determined by local assessors to be the total taxable value of land and additions on the property. | Land | Improvement |
|---|---|---|---|---|
| 2024 | $4,492 | $98,770 | $28,000 | $70,770 |
| 2023 | $4,428 | $98,770 | $28,000 | $70,770 |
| 2022 | $3,987 | $65,380 | $14,280 | $51,100 |
| 2021 | $4,064 | $65,380 | $14,280 | $51,100 |
| 2020 | $4,051 | $65,380 | $14,280 | $51,100 |
| 2019 | $3,588 | $53,730 | $11,900 | $41,830 |
| 2018 | $3,350 | $53,730 | $11,900 | $41,830 |
| 2017 | $3,342 | $53,730 | $11,900 | $41,830 |
| 2016 | $3,123 | $43,090 | $8,960 | $34,130 |
| 2015 | $3,124 | $43,090 | $8,960 | $34,130 |
| 2014 | $3,126 | $43,090 | $8,960 | $34,130 |
| 2013 | $1,552 | $45,325 | $9,415 | $35,910 |
Source: Public Records
Map
Nearby Homes
- 3673 Magnolia St
- 4041 Cypress Ave
- 4209 Marsol Ave
- 3805 Carlotta St
- 3663 Glacial Ln
- Fifth Avenue Plan at The Grove at Beulah Park
- Abbeyville Plan at The Grove at Beulah Park
- Boardwalk Plan at The Grove at Beulah Park
- Woodward Plan at The Grove at Beulah Park
- Park Place Plan at The Grove at Beulah Park
- 3786 Brody Dr Unit Lot 188
- 3747 Brody Dr Unit Lot 219
- 3780 Brody Dr Unit Lot 187
- 3145 Demorest Rd
- 3864 Brody Dr
- 3892 Ponds Edge St
- 4355 Lake George Place
- 3834 Brody Dr
- 4008 Thompson Ave
- 3990 Thompson Ave
- 4091 Sequoia Ave
- 4071 Sequoia Ave
- 4082 Sassafras Ct
- 4101 Sequoia Ave
- 4092 Sassafras Ct
- 3713 Magnolia St
- 4084 Sequoia Ave
- 4100 Sassafras Ct
- 4094 Sequoia Ave
- 4109 Sequoia Ave
- 4102 Sequoia Ave
- 4051 Sequoia Ave
- 4110 Sassafras Ct
- 3712 Magnolia St
- 4110 Sequoia Ave
- 4117 Sequoia Ave
- 4083 Cypress Ave
- 4052 Sequoia Ave
- 4083 Sassafras Ct
- 4093 Cypress Ave