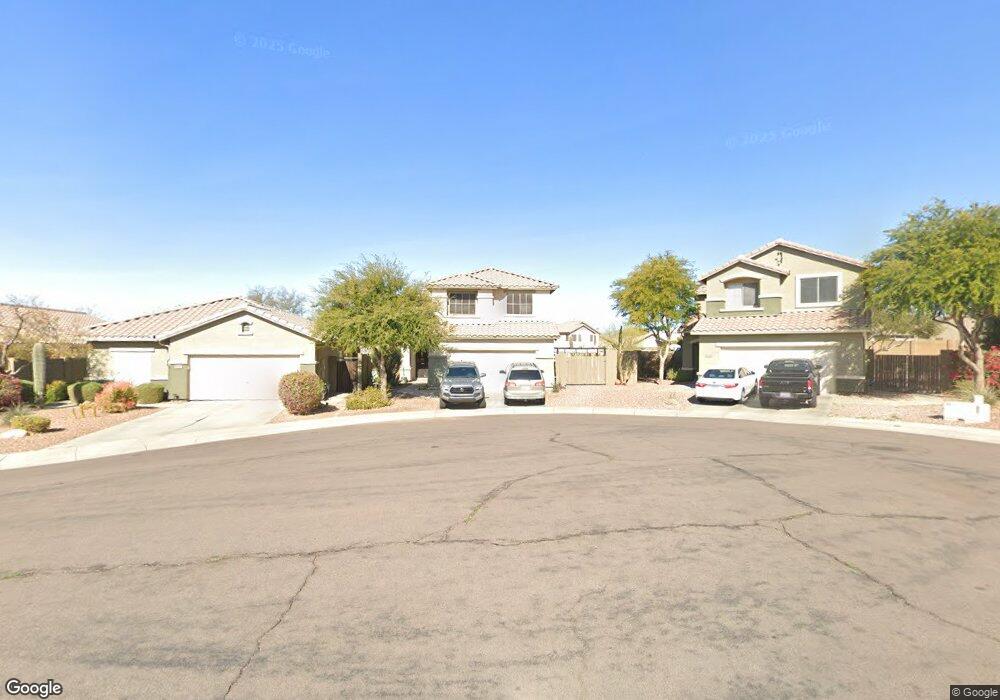
40822 N Mantle Ct Unit 5 Anthem, AZ 85086
Estimated Value: $513,446 - $534,000
4
Beds
3
Baths
2,140
Sq Ft
$244/Sq Ft
Est. Value
About This Home
This home is located at 40822 N Mantle Ct Unit 5, Anthem, AZ 85086 and is currently estimated at $522,112, approximately $243 per square foot. 40822 N Mantle Ct Unit 5 is a home located in Maricopa County with nearby schools including Anthem School, Boulder Creek High School, and BASIS Phoenix North.
Ownership History
Date
Name
Owned For
Owner Type
Purchase Details
Closed on
Feb 15, 2011
Sold by
Patel Nirav
Bought by
Gilbert Kathleen and Gilbert Lonnie E
Current Estimated Value
Home Financials for this Owner
Home Financials are based on the most recent Mortgage that was taken out on this home.
Original Mortgage
$124,800
Outstanding Balance
$85,235
Interest Rate
4.74%
Mortgage Type
New Conventional
Estimated Equity
$436,877
Purchase Details
Closed on
Dec 10, 2010
Sold by
Wallace John W
Bought by
Patel Nivel
Purchase Details
Closed on
Feb 8, 2000
Sold by
Del Webbs Coventry Homes Inc
Bought by
Wallace John W
Home Financials for this Owner
Home Financials are based on the most recent Mortgage that was taken out on this home.
Original Mortgage
$165,200
Interest Rate
8.16%
Mortgage Type
VA
Create a Home Valuation Report for This Property
The Home Valuation Report is an in-depth analysis detailing your home's value as well as a comparison with similar homes in the area
Home Values in the Area
Average Home Value in this Area
Purchase History
| Date | Buyer | Sale Price | Title Company |
|---|---|---|---|
| Gilbert Kathleen | $160,000 | Equity Title Agency Inc | |
| Patel Nirav | -- | Equity Title Agency Inc | |
| Patel Nivel | $121,000 | None Available | |
| Wallace John W | $166,321 | First American Title | |
| Del Webbs Coventry Homes Inc | -- | First American Title |
Source: Public Records
Mortgage History
| Date | Status | Borrower | Loan Amount |
|---|---|---|---|
| Open | Gilbert Kathleen | $124,800 | |
| Previous Owner | Wallace John W | $165,200 |
Source: Public Records
Tax History Compared to Growth
Tax History
| Year | Tax Paid | Tax Assessment Tax Assessment Total Assessment is a certain percentage of the fair market value that is determined by local assessors to be the total taxable value of land and additions on the property. | Land | Improvement |
|---|---|---|---|---|
| 2025 | $2,511 | $23,386 | -- | -- |
| 2024 | $2,362 | $22,272 | -- | -- |
| 2023 | $2,362 | $35,820 | $7,160 | $28,660 |
| 2022 | $2,257 | $26,070 | $5,210 | $20,860 |
| 2021 | $2,325 | $24,270 | $4,850 | $19,420 |
| 2020 | $2,274 | $22,720 | $4,540 | $18,180 |
| 2019 | $2,230 | $21,520 | $4,300 | $17,220 |
| 2018 | $2,160 | $20,130 | $4,020 | $16,110 |
| 2017 | $2,117 | $19,000 | $3,800 | $15,200 |
| 2016 | $1,816 | $17,950 | $3,590 | $14,360 |
| 2015 | $1,762 | $16,830 | $3,360 | $13,470 |
Source: Public Records
Map
Nearby Homes
- 40915 N Columbia Trail
- 3437 W Walden Way
- 3546 W Webster Ct Unit 6
- 40924 N Crockett Trail
- 3629 W Amerigo Ct Unit 41B
- 40711 N Ericson Ln
- 40701 N Union Trail
- 3033 W Keller Dr
- 40128 N Integrity Trail
- 3051 W Sousa Ct
- 3747 W Memorial Dr Unit 67
- 41310 N Clear Crossing Ct
- 40015 N Pride Dr
- 3716 W Medinah Way
- 3544 W Twain Dr
- 41646 N Emerald Lake Dr
- 3737 W Medinah Way
- 3635 W Mccauley Ct
- 3662 W Mccauley Ct Unit 101
- 3336 W King Dr Unit 9
- 40816 N Mantle Ct
- 40828 N Mantle Ct
- 40810 N Mantle Ct
- 40921 N Columbia Trail
- 40909 N Columbia Trail
- 40833 N Mantle Ct
- 40804 N Mantle Ct
- 40927 N Columbia Trail
- 40903 N Columbia Trail
- 3401 W Steinbeck Dr Unit 5
- 3359 W Steinbeck Dr Unit 5
- 3413 W Steinbeck Dr Unit 5
- 3353 W Steinbeck Dr Unit 5
- 40827 N Mantle Ct
- 3419 W Steinbeck Dr
- 40815 N Mantle Ct Unit 5
- 40821 N Mantle Ct Unit 5
- 40809 N Mantle Ct
- 3347 W Steinbeck Dr
- 3429 W Steinbeck Dr