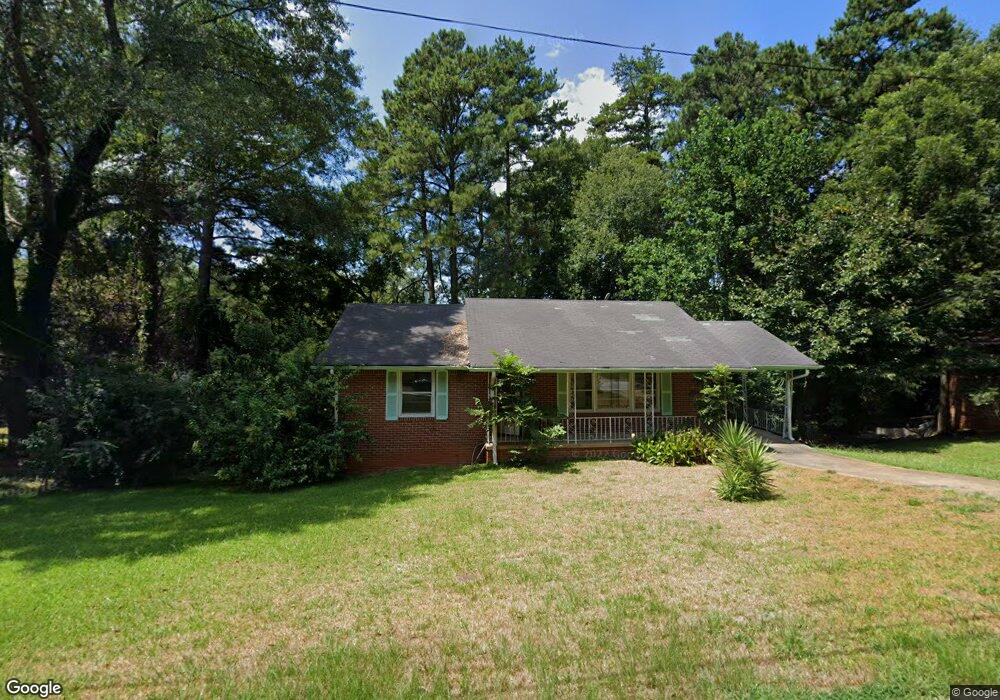
4083 David Dr Forest Park, GA 30297
Estimated Value: $166,564 - $191,000
3
Beds
1
Bath
1,277
Sq Ft
$139/Sq Ft
Est. Value
About This Home
This home is located at 4083 David Dr, Forest Park, GA 30297 and is currently estimated at $177,891, approximately $139 per square foot. 4083 David Dr is a home located in Clayton County with nearby schools including Huie Elementary School, Forest Park Middle School, and Forest Park High School.
Ownership History
Date
Name
Owned For
Owner Type
Purchase Details
Closed on
Oct 3, 2012
Sold by
Tolson Becky Ann
Bought by
Tolson Enterprise Llc
Current Estimated Value
Purchase Details
Closed on
Jul 13, 2010
Sold by
Hud-Housing Of Urban Dev
Bought by
Tolson Becky A
Purchase Details
Closed on
Dec 1, 2009
Sold by
Flagstar Bk Fsb
Bought by
Hud-Housing Of Urban Dev
Purchase Details
Closed on
Apr 30, 2008
Sold by
Banks Kelvin U
Bought by
Banks Kelvin U and Mcclendon Karena
Home Financials for this Owner
Home Financials are based on the most recent Mortgage that was taken out on this home.
Original Mortgage
$121,800
Interest Rate
5.82%
Mortgage Type
FHA
Purchase Details
Closed on
Aug 25, 2000
Sold by
Gheatwood Roy G and Gheatwood Mary T
Bought by
Mcclendon Karena S
Home Financials for this Owner
Home Financials are based on the most recent Mortgage that was taken out on this home.
Original Mortgage
$79,859
Interest Rate
8.24%
Mortgage Type
FHA
Create a Home Valuation Report for This Property
The Home Valuation Report is an in-depth analysis detailing your home's value as well as a comparison with similar homes in the area
Home Values in the Area
Average Home Value in this Area
Purchase History
| Date | Buyer | Sale Price | Title Company |
|---|---|---|---|
| Tolson Enterprise Llc | -- | -- | |
| Tolson Becky A | -- | -- | |
| Hud-Housing Of Urban Dev | -- | -- | |
| Flagstar Bk Fsb | $128,140 | -- | |
| Banks Kelvin U | -- | -- | |
| Banks Kelvin U | -- | -- | |
| Mcclendon Karena S | $79,900 | -- |
Source: Public Records
Mortgage History
| Date | Status | Borrower | Loan Amount |
|---|---|---|---|
| Previous Owner | Banks Kelvin U | $121,800 | |
| Previous Owner | Mcclendon Karena S | $79,859 |
Source: Public Records
Tax History
| Year | Tax Paid | Tax Assessment Tax Assessment Total Assessment is a certain percentage of the fair market value that is determined by local assessors to be the total taxable value of land and additions on the property. | Land | Improvement |
|---|---|---|---|---|
| 2025 | $2,629 | $68,640 | $6,400 | $62,240 |
| 2024 | $2,427 | $62,200 | $6,400 | $55,800 |
| 2023 | $2,002 | $55,440 | $6,400 | $49,040 |
| 2022 | $1,724 | $43,920 | $6,400 | $37,520 |
| 2021 | $1,465 | $37,080 | $6,400 | $30,680 |
| 2020 | $1,147 | $28,671 | $6,400 | $22,271 |
| 2019 | $1,055 | $25,983 | $3,200 | $22,783 |
| 2018 | $870 | $21,424 | $3,200 | $18,224 |
| 2017 | $727 | $17,874 | $3,200 | $14,674 |
| 2016 | $709 | $17,423 | $3,200 | $14,223 |
| 2015 | $634 | $0 | $0 | $0 |
| 2014 | $529 | $13,288 | $3,200 | $10,088 |
Source: Public Records
Map
Nearby Homes
- 4082 Sweetbriar Ln
- 1082 Holly Cirlce Cir
- 4041 Browne Ct
- 4031 Browne Ct
- 3851 Bonnie Ln SE
- 811 Kennesaw Dr
- 1153 Rocksprings St Unit 3
- 4328 Rushmore Place
- 766 Cascade Dr
- 0 Jonesboro Rd Unit 20166054
- 0 Jonesboro Rd Unit 7690519
- 996 Forest Valley Dr SE
- 4226 Oakview Dr
- 1241 Richmond Ct SE
- 1308 Rocksprings St
- 1367 Oakview Cir
- 1053 MacKets Ct SE
- 4436 Hillpine Rd
- 4317 Brookside Dr
- 4368 Rocky View Dr
- 4075 David Dr
- 4095 David Dr Unit 3
- 4094 Camellia Cir
- 4088 Camellia Cir Unit 1
- 4084 David Dr
- 4100 Camellia Cir
- 4076 David Dr
- 4094 David Dr
- 4065 David Dr
- 4103 David Dr Unit 3
- 4080 Camellia Cir
- 4108 Camellia Cir
- 4108 Camellia Cir Unit 14
- 4102 David Dr
- 4066 David Dr
- 4087 Scott Dr
- 4055 David Dr
- 4079 Scott Dr
- 4113 David Dr
- 4095 Scott Dr
Your Personal Tour Guide
Ask me questions while you tour the home.