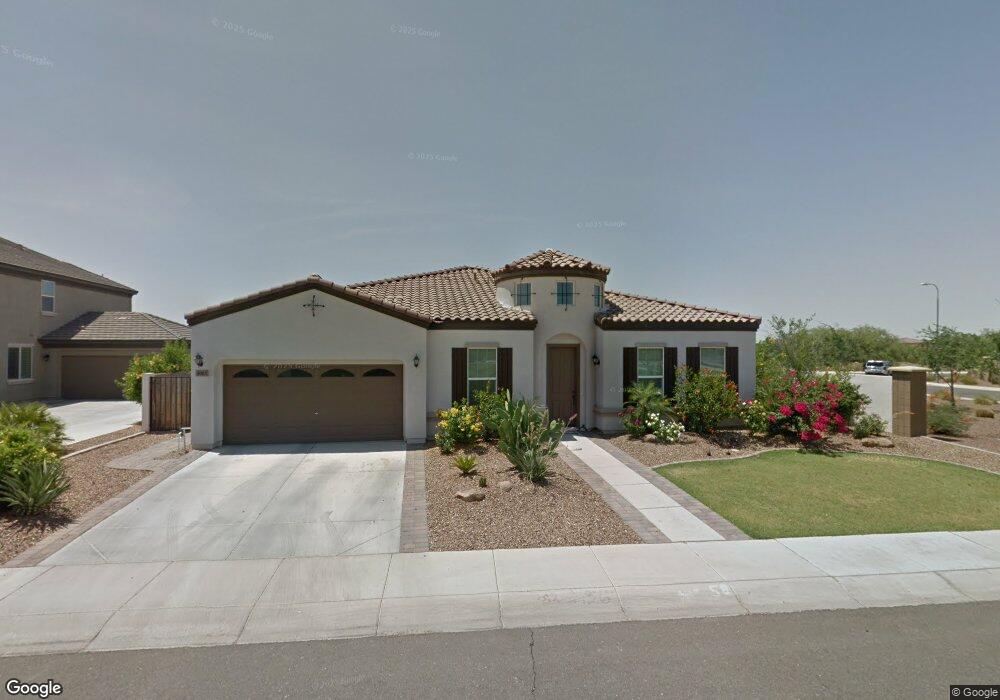
4085 E Blue Ridge Place Chandler, AZ 85249
South Chandler NeighborhoodEstimated Value: $769,776 - $897,000
--
Bed
1
Bath
3,056
Sq Ft
$277/Sq Ft
Est. Value
About This Home
This home is located at 4085 E Blue Ridge Place, Chandler, AZ 85249 and is currently estimated at $845,194, approximately $276 per square foot. 4085 E Blue Ridge Place is a home with nearby schools including Audrey & Robert Ryan Elementary School, Willie & Coy Payne Jr. High School, and Legacy Online Academy.
Ownership History
Date
Name
Owned For
Owner Type
Purchase Details
Closed on
Jul 28, 2025
Sold by
Kabir Firoj and Khan Tulip
Bought by
Kabir Family Trust and Kabir
Current Estimated Value
Purchase Details
Closed on
Jul 22, 2020
Sold by
Kabir Firoj
Bought by
Kabir Firoj and Khan Tulip
Home Financials for this Owner
Home Financials are based on the most recent Mortgage that was taken out on this home.
Original Mortgage
$238,000
Interest Rate
3.2%
Mortgage Type
New Conventional
Purchase Details
Closed on
Oct 5, 2012
Sold by
T3 Homes Llc
Bought by
Kabir Firoj
Home Financials for this Owner
Home Financials are based on the most recent Mortgage that was taken out on this home.
Original Mortgage
$279,050
Interest Rate
3.63%
Mortgage Type
New Conventional
Purchase Details
Closed on
Oct 4, 2012
Sold by
Khan Tulip
Bought by
Kabir Firoj
Home Financials for this Owner
Home Financials are based on the most recent Mortgage that was taken out on this home.
Original Mortgage
$279,050
Interest Rate
3.63%
Mortgage Type
New Conventional
Create a Home Valuation Report for This Property
The Home Valuation Report is an in-depth analysis detailing your home's value as well as a comparison with similar homes in the area
Home Values in the Area
Average Home Value in this Area
Purchase History
| Date | Buyer | Sale Price | Title Company |
|---|---|---|---|
| Kabir Family Trust | -- | None Listed On Document | |
| Kabir Firoj | -- | First American Title Ins Co | |
| Kabir Firoj | $293,774 | Lawyers Title Of Arizona Inc | |
| Kabir Firoj | -- | Lawyers Title Of Arizona Inc | |
| T3 Homes Llc | -- | Lawyers Title Of Arizona Inc |
Source: Public Records
Mortgage History
| Date | Status | Borrower | Loan Amount |
|---|---|---|---|
| Previous Owner | Kabir Firoj | $238,000 | |
| Previous Owner | Kabir Firoj | $279,050 | |
| Previous Owner | T3 Homes Llc | $279,050 |
Source: Public Records
Tax History Compared to Growth
Tax History
| Year | Tax Paid | Tax Assessment Tax Assessment Total Assessment is a certain percentage of the fair market value that is determined by local assessors to be the total taxable value of land and additions on the property. | Land | Improvement |
|---|---|---|---|---|
| 2025 | $3,617 | $44,571 | -- | -- |
| 2024 | $3,472 | $42,449 | -- | -- |
| 2023 | $3,472 | $58,370 | $11,670 | $46,700 |
| 2022 | $3,345 | $44,420 | $8,880 | $35,540 |
| 2021 | $3,446 | $40,760 | $8,150 | $32,610 |
| 2020 | $3,422 | $39,070 | $7,810 | $31,260 |
| 2019 | $3,287 | $36,630 | $7,320 | $29,310 |
| 2018 | $3,181 | $33,920 | $6,780 | $27,140 |
| 2017 | $2,967 | $34,660 | $6,930 | $27,730 |
| 2016 | $2,858 | $34,880 | $6,970 | $27,910 |
| 2015 | $2,766 | $32,280 | $6,450 | $25,830 |
Source: Public Records
Map
Nearby Homes
- 4630 S Amethyst Dr
- 4060 E Canyon Way
- 4080 E Canyon Way
- 4640 S Big Horn Dr
- 3827 E Mead Dr
- 4150 E Beechnut Place
- 5070 S Pinaleno Place
- 3840 E San Mateo Way
- 4390 S White Dr
- 1244 E Prescott St
- 3556 E Bartlett Place
- 1278 E Prescott St
- 1286 E Prescott St
- 23817 S 148th St
- 1224 E Tonto Dr
- 1232 E Tonto Dr
- 4204 E Grand Canyon Dr
- 1324 E Prescott St
- 4414 E Glacier Place
- 1342 E Prescott St
- 4105 E Blue Ridge Place
- 4125 E Blue Ridge Place
- 4106 E Blue Ridge Place
- 4065 E Blue Ridge Place
- 4126 E Blue Ridge Place
- 4145 E Blue Ridge Place
- 4146 E Blue Ridge Place
- 4045 E Blue Ridge Place
- 4702 S Onyx Dr
- 4123 E Mead Way
- 4165 E Blue Ridge Place
- 4166 E Blue Ridge Place
- 4025 E Blue Ridge Place
- 4143 E Mead Way
- 4692 S Onyx Dr
- 4185 E Blue Ridge Place
- 4711 S Amethyst Dr
- 4186 E Blue Ridge Place
- 4163 E Mead Way
- 4701 S Amethyst Dr