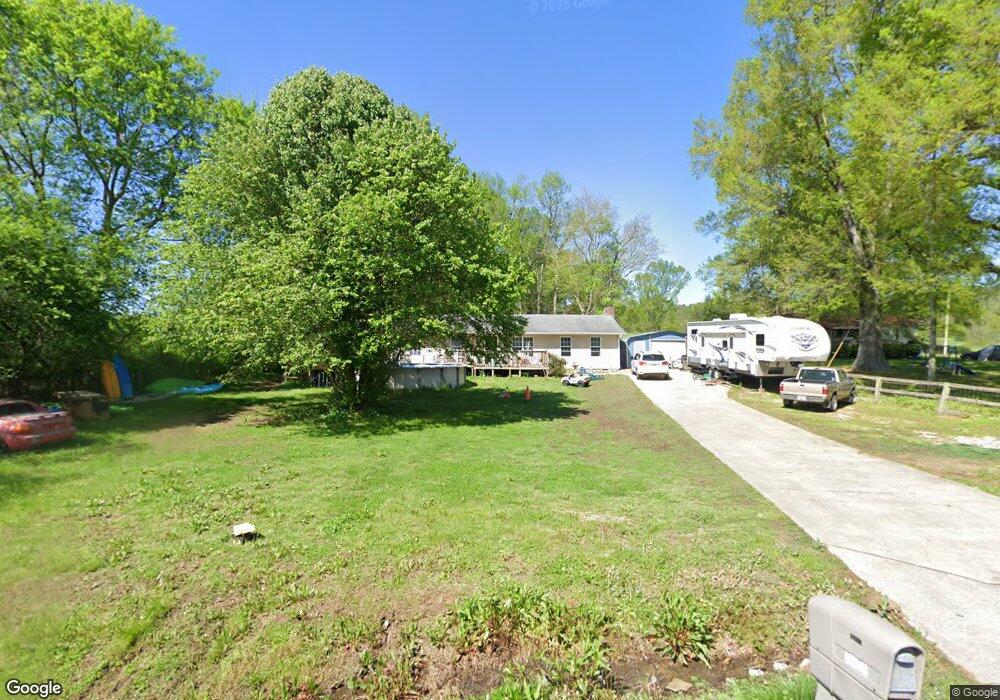
4085 Logan Rd Rocky Face, GA 30740
Estimated Value: $191,000 - $289,000
4
Beds
3
Baths
1,796
Sq Ft
$135/Sq Ft
Est. Value
About This Home
This home is located at 4085 Logan Rd, Rocky Face, GA 30740 and is currently estimated at $242,425, approximately $134 per square foot. 4085 Logan Rd is a home located in Whitfield County with nearby schools including Westside Elementary School, Westside Middle School, and Northwest Whitfield County High School.
Ownership History
Date
Name
Owned For
Owner Type
Purchase Details
Closed on
Oct 28, 2005
Sold by
Washington Mutual Bank
Bought by
Cochran Christopher S and Cochran Samantha
Current Estimated Value
Home Financials for this Owner
Home Financials are based on the most recent Mortgage that was taken out on this home.
Original Mortgage
$23,980
Interest Rate
5.84%
Mortgage Type
New Conventional
Purchase Details
Closed on
Aug 2, 2005
Sold by
Not Provided
Bought by
Cochran Christopher S and Cochran Samantha
Purchase Details
Closed on
Feb 28, 2003
Sold by
Redwine David Lewis and Alma Rut
Bought by
Stigall Michael A and Stigall Kimberly D
Purchase Details
Closed on
Oct 1, 1991
Bought by
Redwine David Lewis and Alma Ruth
Create a Home Valuation Report for This Property
The Home Valuation Report is an in-depth analysis detailing your home's value as well as a comparison with similar homes in the area
Purchase History
| Date | Buyer | Sale Price | Title Company |
|---|---|---|---|
| Cochran Christopher S | $119,000 | -- | |
| Cochran Christopher S | -- | -- | |
| Stigall Michael A | -- | -- | |
| Redwine David Lewis | $45,000 | -- |
Source: Public Records
Mortgage History
| Date | Status | Borrower | Loan Amount |
|---|---|---|---|
| Closed | Cochran Christopher S | $23,980 |
Source: Public Records
Tax History
| Year | Tax Paid | Tax Assessment Tax Assessment Total Assessment is a certain percentage of the fair market value that is determined by local assessors to be the total taxable value of land and additions on the property. | Land | Improvement |
|---|---|---|---|---|
| 2025 | $1,612 | $79,829 | $3,876 | $75,953 |
| 2024 | $1,612 | $79,829 | $3,876 | $75,953 |
| 2023 | $1,512 | $54,272 | $2,972 | $51,300 |
| 2022 | $879 | $38,341 | $2,609 | $35,732 |
| 2021 | $879 | $38,341 | $2,609 | $35,732 |
| 2020 | $897 | $38,341 | $2,609 | $35,732 |
| 2019 | $906 | $38,341 | $2,609 | $35,732 |
| 2018 | $904 | $37,967 | $2,235 | $35,732 |
| 2017 | $904 | $37,967 | $2,235 | $35,732 |
| 2016 | $715 | $32,452 | $2,235 | $30,217 |
| 2014 | $575 | $28,765 | $2,449 | $26,316 |
| 2013 | -- | $28,765 | $2,449 | $26,316 |
Source: Public Records
Map
Nearby Homes
- 1446 Lafayette Rd
- 0 Turkey Trot Dr Unit 1529753
- 0 Turkey Trot Dr Unit 1529747
- 1005 Robin Way
- 0 N Jimmy Dr Unit 1525500
- 0 N Jimmy Dr Unit 10660158
- 4125 Dunnagan Rd
- 4180 S Jimmy Dr
- 4177 S Jimmy Dr
- 2904 Carol Cir
- 2950 Davis Rd
- 110 Windy Hill Dr
- 2984 Rebecca Cir
- 1614 Kendall Rd
- 2906 Davis Rd
- 3957 Lodge Rd
- 00 Joe Robertson Rd
- 820 Joe Robertson Rd
- 0 Clement Rd Unit 7454770
- 0 Clement Rd Unit 10376510
- 4070 Gordon Springs Rd
- 4052 Logan Rd
- 4111 Logan Rd
- 4039 Logan Rd
- 4036 Logan Rd
- 232 Willaby Way
- 1621 Saddlebrook Dr
- 4030 Gordon Springs Rd
- 1616 Lafayette Rd
- 1619 Saddlebrook Dr
- 1623 Saddlebrook Dr
- 4045 Gordon Springs Rd
- 1694 Lafayette Rd
- 1694 Lafayette Rd Unit Tract 2
- 1694 Lafayette Rd Unit Tract 1
- 4176 Logan Rd
- 4055 Gordon Springs Rd
- 1622 Saddlebrook Dr
- 1617 Saddlebrook Dr
- 1664 Lafayette Rd
Your Personal Tour Guide
Ask me questions while you tour the home.