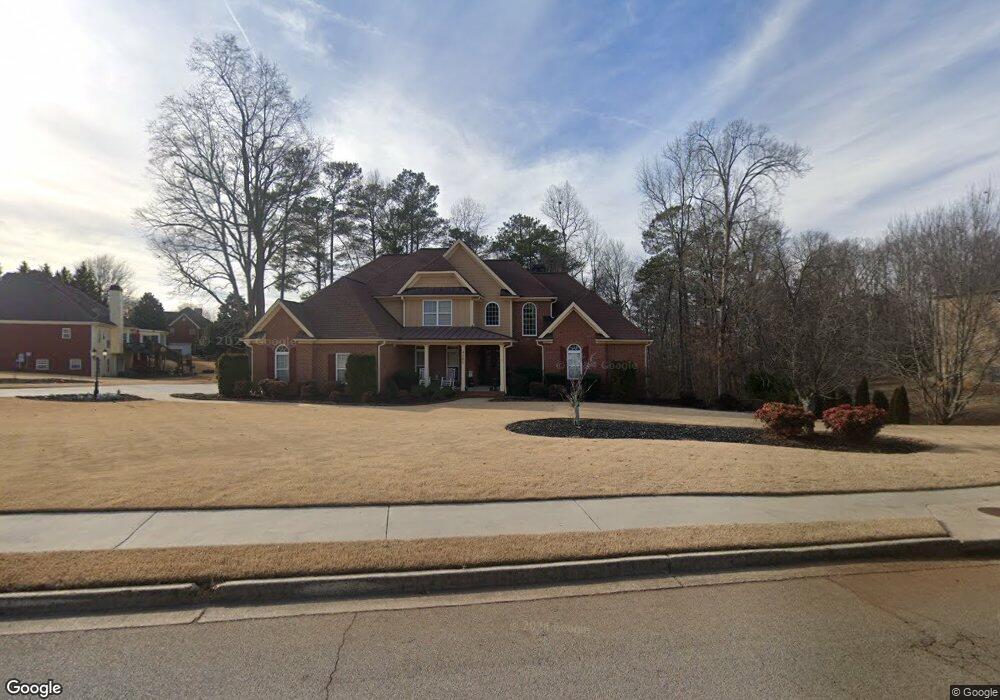
4085 Maple Crest Ct Winston, GA 30187
Bill Arp NeighborhoodEstimated Value: $529,000 - $631,000
5
Beds
5
Baths
3,345
Sq Ft
$169/Sq Ft
Est. Value
About This Home
This home is located at 4085 Maple Crest Ct, Winston, GA 30187 and is currently estimated at $564,577, approximately $168 per square foot. 4085 Maple Crest Ct is a home located in Douglas County with nearby schools including Mason Creek Elementary School, Mason Creek Middle School, and Alexander High School.
Ownership History
Date
Name
Owned For
Owner Type
Purchase Details
Closed on
Jan 11, 2021
Sold by
Williams Reginald N
Bought by
Williams Reginald N and Williams Pascha W
Current Estimated Value
Purchase Details
Closed on
Jan 1, 2021
Sold by
Williams Reginald N
Bought by
Williams Reginald N and Williams Pascha
Purchase Details
Closed on
Oct 26, 2011
Sold by
Freeman Tabetha A
Bought by
Williams Reginald N
Home Financials for this Owner
Home Financials are based on the most recent Mortgage that was taken out on this home.
Original Mortgage
$194,400
Interest Rate
4.09%
Mortgage Type
New Conventional
Purchase Details
Closed on
Jun 1, 2006
Sold by
Premier Props
Bought by
Freeman Brian K and Freeman Tabetha A
Home Financials for this Owner
Home Financials are based on the most recent Mortgage that was taken out on this home.
Original Mortgage
$374,000
Interest Rate
6.44%
Mortgage Type
New Conventional
Create a Home Valuation Report for This Property
The Home Valuation Report is an in-depth analysis detailing your home's value as well as a comparison with similar homes in the area
Home Values in the Area
Average Home Value in this Area
Purchase History
| Date | Buyer | Sale Price | Title Company |
|---|---|---|---|
| Williams Reginald N | -- | None Listed On Document | |
| Williams Reginald N | -- | -- | |
| Williams Reginald N | $243,000 | -- | |
| Williams Reginald N | -- | -- | |
| Freeman Brian K | $402,800 | -- |
Source: Public Records
Mortgage History
| Date | Status | Borrower | Loan Amount |
|---|---|---|---|
| Previous Owner | Williams Reginald N | $194,400 | |
| Previous Owner | Freeman Brian K | $374,000 |
Source: Public Records
Tax History
| Year | Tax Paid | Tax Assessment Tax Assessment Total Assessment is a certain percentage of the fair market value that is determined by local assessors to be the total taxable value of land and additions on the property. | Land | Improvement |
|---|---|---|---|---|
| 2024 | $5,294 | $207,400 | $24,800 | $182,600 |
| 2023 | $5,294 | $207,400 | $24,800 | $182,600 |
| 2022 | $5,469 | $207,400 | $24,800 | $182,600 |
| 2021 | $4,676 | $167,360 | $23,560 | $143,800 |
| 2020 | $4,390 | $149,440 | $19,840 | $129,600 |
| 2019 | $4,066 | $144,440 | $19,840 | $124,600 |
| 2018 | $4,008 | $140,640 | $19,840 | $120,800 |
| 2017 | $3,768 | $126,120 | $19,840 | $106,280 |
| 2016 | $3,689 | $119,600 | $19,840 | $99,760 |
| 2015 | $3,478 | $113,120 | $19,320 | $93,800 |
| 2014 | $3,478 | $105,200 | $19,320 | $85,880 |
| 2013 | -- | $102,080 | $18,840 | $83,240 |
Source: Public Records
Map
Nearby Homes
- 7465 Rolling Oaks Dr
- 4067 Mason Creek Rd
- 7448 Berea Rd
- 7537 Berea Rd
- 7420 Mobley Ct Unit 6
- 7130 Nantz Rd
- 3761 Falls Trail
- 4089 Roy Ct
- 4049 Roy Ct
- 3737 Falls Trail
- 3630 Falls Trail
- 7908 Lambert Rd
- 6917 Laurelwood Dr
- 6535 Manor Creek Dr
- 4462 Highway 5
- 7946 Lambert Rd
- 6867 Laurelwood Dr
- 6857 Alexander Pkwy
- 6762 Oakland Dr
- 3950 Sherwood Dr
- 7400 Rolling Oaks Dr
- 4065 Maple Crest Ct Unit 2
- 4070 Maple Crest Ct
- 4080 Maple Crest Ct
- 4090 Maple Crest Ct
- 4055 Maple Crest Ct Unit 2
- 4100 Maple Crest Ct
- 7410 Rolling Oaks Dr
- 4060 Maple Crest Ct Unit 62
- 4060 Maple Crest Ct Unit 2
- 4105 Maple Crest Ct
- 4045 Maple Crest Ct
- 4050 Maple Crest Ct
- 7232 Berea Rd
- 7405 Rolling Oaks Dr
- 7430 Rolling Oaks Dr
- 7403 Cypress Trace Unit 2
- 4040 Maple Crest Ct Unit 2
- 7341 Berea Rd
- 7450 Rolling Oaks Dr
Your Personal Tour Guide
Ask me questions while you tour the home.