Estimated Value: $243,000 - $281,000
3
Beds
2
Baths
1,920
Sq Ft
$136/Sq Ft
Est. Value
About This Home
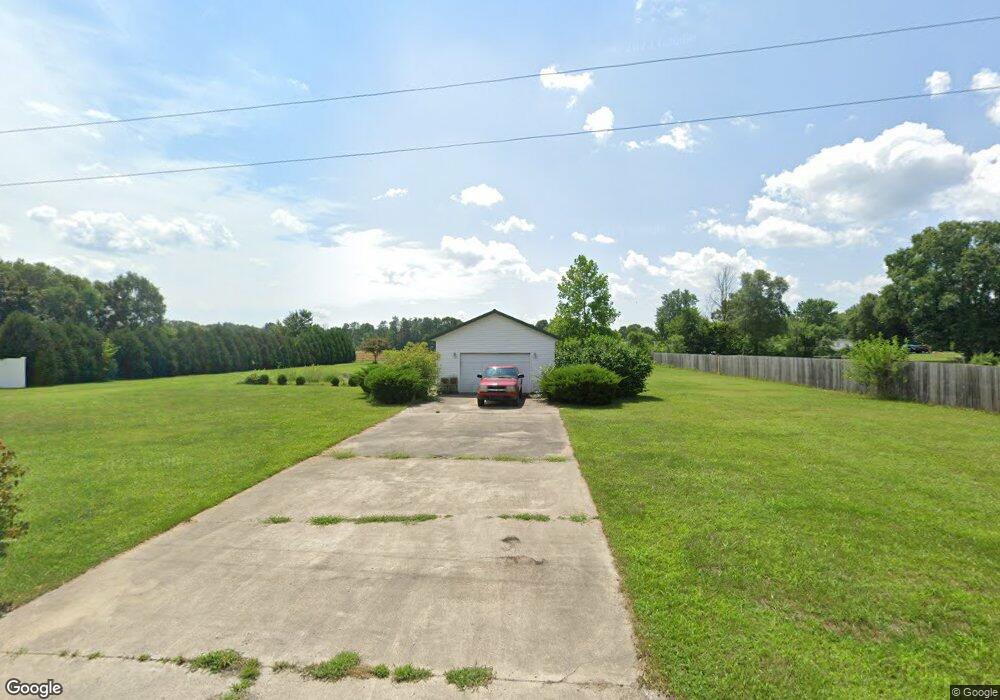
This home is located at 4087 E 175 N, Knox, IN 46534 and is currently estimated at $262,000, approximately $136 per square foot. 4087 E 175 N is a home located in Starke County with nearby schools including Knox Community Elementary School, Knox Community Middle School, and Knox Community High School.
Ownership History
Date
Name
Owned For
Owner Type
Purchase Details
Closed on
Oct 28, 2014
Sold by
Robson Charles and Robson Mary Jane
Bought by
Wherein Lake City Bank
Current Estimated Value
Purchase Details
Closed on
Jul 31, 2007
Sold by
Minix Michael H and Minix Ember R
Bought by
Robson Charles and Robson Maryjane
Home Financials for this Owner
Home Financials are based on the most recent Mortgage that was taken out on this home.
Original Mortgage
$130,429
Interest Rate
6.75%
Mortgage Type
Adjustable Rate Mortgage/ARM
Purchase Details
Closed on
Jun 18, 2005
Sold by
Vlad Nick
Bought by
Minix Michael H
Create a Home Valuation Report for This Property
The Home Valuation Report is an in-depth analysis detailing your home's value as well as a comparison with similar homes in the area
Purchase History
| Date | Buyer | Sale Price | Title Company |
|---|---|---|---|
| Wherein Lake City Bank | $9,501 | None Available | |
| Robson Charles | $127,000 | Starke County Abstract | |
| Robson Charles | -- | None Available | |
| Minix Michael H | -- | None Available |
Source: Public Records
Mortgage History
| Date | Status | Borrower | Loan Amount |
|---|---|---|---|
| Previous Owner | Robson Charles | $130,429 |
Source: Public Records
Tax History Compared to Growth
Tax History
| Year | Tax Paid | Tax Assessment Tax Assessment Total Assessment is a certain percentage of the fair market value that is determined by local assessors to be the total taxable value of land and additions on the property. | Land | Improvement |
|---|---|---|---|---|
| 2024 | $384 | $23,900 | $14,400 | $9,500 |
| 2023 | $349 | $22,600 | $13,000 | $9,600 |
| 2022 | $349 | $22,100 | $12,000 | $10,100 |
| 2021 | $369 | $21,000 | $12,000 | $9,000 |
| 2020 | $487 | $21,000 | $12,000 | $9,000 |
| 2019 | $484 | $20,500 | $12,000 | $8,500 |
| 2018 | $455 | $20,800 | $12,500 | $8,300 |
| 2017 | $339 | $15,700 | $15,100 | $600 |
| 2016 | $349 | $15,700 | $15,100 | $600 |
| 2014 | $635 | $107,100 | $15,800 | $91,300 |
| 2013 | $615 | $107,400 | $15,800 | $91,600 |
Source: Public Records
Map
Nearby Homes
- 1563 U S 35
- 4500 E 300 N
- V/L E 100 N
- 10300 E 150 N
- 303 E Lake St
- 203 W Lake St
- 207 W Lake St
- 1103 E Lake St
- 105 S Bower St
- 302 S Main St
- 4152 S State Road 35
- 305 W New York St
- 503 S Heaton St
- 705 E Saint Louis St
- 1675 U S 35
- 402 E Saint Louis St
- 601 S Heaton St
- 625 S East St
- 701 S Shield St
- 703 S Main St