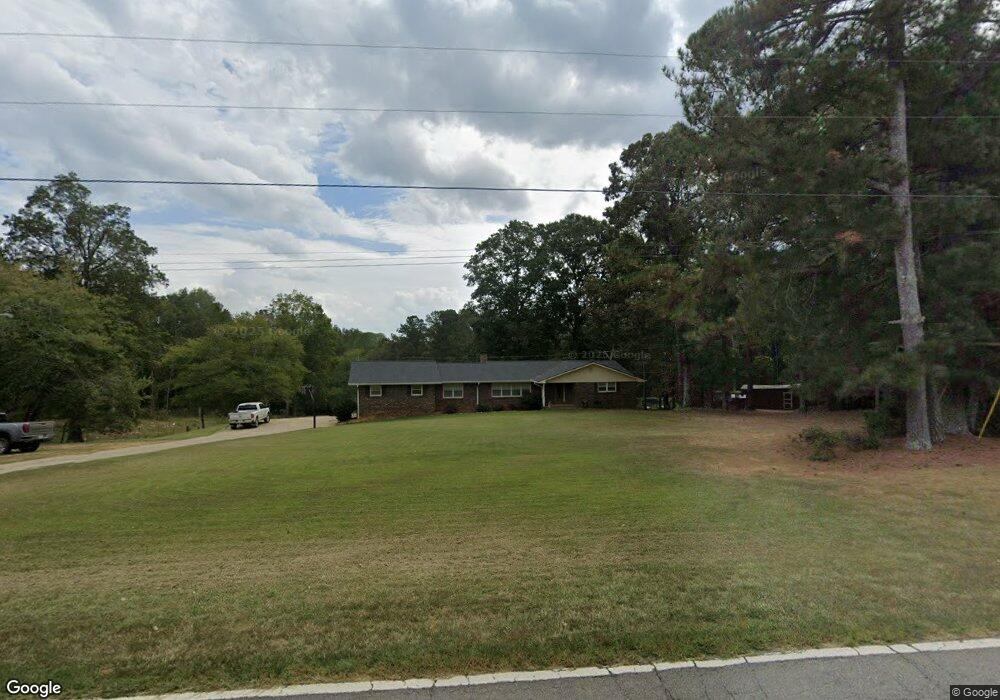
4087 Stateline Rd Bowdon, GA 30108
Estimated Value: $319,033 - $470,000
3
Beds
2
Baths
2,295
Sq Ft
$162/Sq Ft
Est. Value
About This Home
This home is located at 4087 Stateline Rd, Bowdon, GA 30108 and is currently estimated at $371,008, approximately $161 per square foot. 4087 Stateline Rd is a home located in Carroll County with nearby schools including Bowdon Elementary School, Bowdon Middle School, and Bowdon High School.
Ownership History
Date
Name
Owned For
Owner Type
Purchase Details
Closed on
Aug 29, 2008
Sold by
Jackson Wesley
Bought by
Crumbley Tracy A
Current Estimated Value
Home Financials for this Owner
Home Financials are based on the most recent Mortgage that was taken out on this home.
Original Mortgage
$168,750
Outstanding Balance
$110,641
Interest Rate
6.48%
Mortgage Type
FHA
Estimated Equity
$260,367
Purchase Details
Closed on
Nov 3, 2004
Sold by
Federal Home Loan Mortgage Cor
Bought by
Jackson Wesley and Jackson Farrah
Purchase Details
Closed on
Jun 1, 2004
Sold by
Gmac Mortgage Corp
Bought by
Federal Home Loan Mortgage Corp
Purchase Details
Closed on
May 1, 2004
Sold by
Stapler Roger K and Stapler La
Bought by
Gmac Mortgage Corp
Purchase Details
Closed on
Oct 14, 1994
Bought by
Stapler Roger K and Stapler La
Purchase Details
Closed on
May 24, 1991
Bought by
Stapler
Create a Home Valuation Report for This Property
The Home Valuation Report is an in-depth analysis detailing your home's value as well as a comparison with similar homes in the area
Purchase History
| Date | Buyer | Sale Price | Title Company |
|---|---|---|---|
| Crumbley Tracy A | $171,900 | -- | |
| Jackson Wesley | $124,000 | -- | |
| Jackson Wesley | $124,000 | -- | |
| Federal Home Loan Mortgage Corp | $85,700 | -- | |
| Gmac Mortgage Corp | $85,700 | -- | |
| Stapler Roger K | $99,000 | -- | |
| Stapler | -- | -- |
Source: Public Records
Mortgage History
| Date | Status | Borrower | Loan Amount |
|---|---|---|---|
| Open | Crumbley Tracy A | $168,750 |
Source: Public Records
Tax History
| Year | Tax Paid | Tax Assessment Tax Assessment Total Assessment is a certain percentage of the fair market value that is determined by local assessors to be the total taxable value of land and additions on the property. | Land | Improvement |
|---|---|---|---|---|
| 2025 | $2,358 | $105,398 | $12,970 | $92,428 |
| 2024 | $2,384 | $105,398 | $12,970 | $92,428 |
| 2023 | $2,384 | $95,045 | $10,376 | $84,669 |
| 2022 | $1,880 | $74,945 | $6,917 | $68,028 |
| 2021 | $1,638 | $63,894 | $5,534 | $58,360 |
| 2020 | $1,492 | $58,120 | $5,031 | $53,089 |
| 2019 | $1,394 | $53,853 | $5,031 | $48,822 |
| 2018 | $1,319 | $50,218 | $5,031 | $45,187 |
| 2017 | $1,323 | $50,218 | $5,031 | $45,187 |
| 2016 | $1,323 | $50,218 | $5,031 | $45,187 |
| 2015 | $1,381 | $49,375 | $7,304 | $42,071 |
| 2014 | $1,387 | $49,375 | $7,304 | $42,071 |
Source: Public Records
Map
Nearby Homes
- 3399 Stateline Rd
- 695 Frost Rd
- 2961 W Highway 166
- 2875 W Highway 166
- 2140 W Highway 166
- 80 County Road 624
- 80 County Rd 624
- 369 Cavender Ln
- 80 Hand Rd
- 339 Cavender Ln
- 0 Ayers Rd Unit 148384
- 380 Ayers Rd Unit 149
- 380 Ayers Rd
- 0 W Highway 166 Unit 10700336
- 0 W Highway 166 Unit 150705
- 0 Stateline Rd Unit 21555538
- 21984 Main St
- 0 Bartlett Cir Unit 10666514
- 1121 Kansas-Jake Rd
- 4074 Stateline Rd
- 3975 Stateline Rd
- 91 Oscar Williams Rd
- 101 Oscar Williams Rd
- 4205 Stateline Rd
- 1350 Hillcrest Rd
- 115 Oscar Williams Rd
- 3887 Stateline Rd
- 1284 Hillcrest Rd Unit 2.40AC
- 1300 Hillcrest Rd
- 3956 Stateline Rd
- 132 Oscar Williams Rd
- 1200 Hillcrest Rd
- 171 Oscar Williams Rd
- 1420 Hillcrest Rd
- 190 Oscar Williams Rd
- 1500 Hillcrest Rd
- 3837 Stateline Rd
- 3799 Stateline Rd
- 3809 Stateline Rd
Your Personal Tour Guide
Ask me questions while you tour the home.