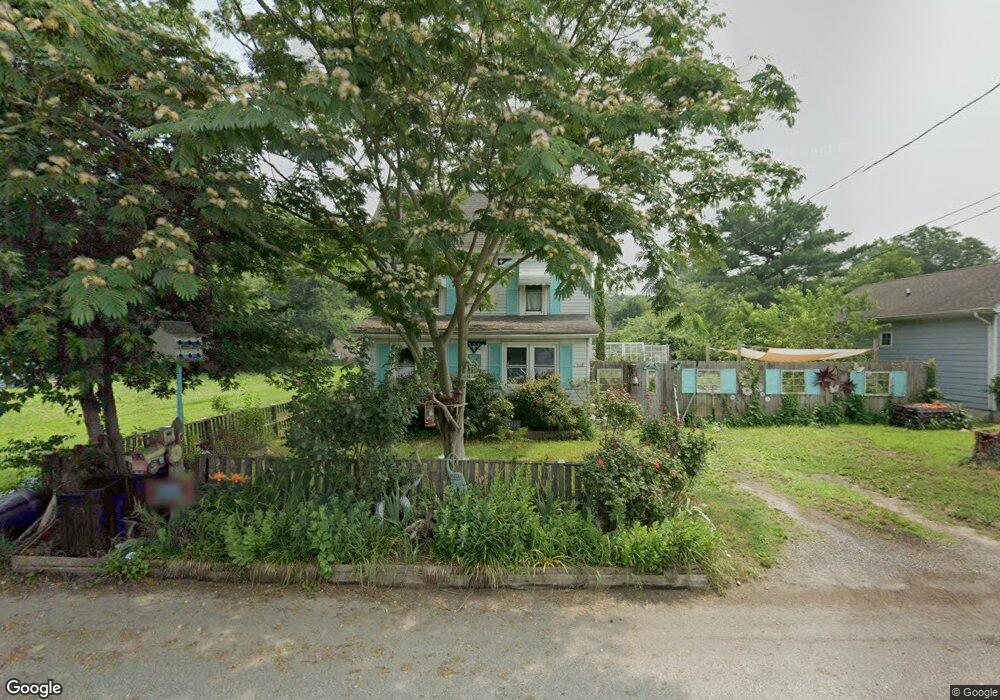
408A Charles St Hurlock, MD 21643
Estimated Value: $196,980 - $213,000
Studio
--
Bath
1,066
Sq Ft
$190/Sq Ft
Est. Value
About This Home
This home is located at 408A Charles St, Hurlock, MD 21643 and is currently estimated at $202,995, approximately $190 per square foot. 408A Charles St is a home located in Dorchester County with nearby schools including Hurlock Elementary School, North Dorchester Middle School, and North Dorchester High School.
Ownership History
Date
Name
Owned For
Owner Type
Purchase Details
Closed on
Jul 28, 2017
Sold by
Habitat For Humanity Choptank Inc
Bought by
Cummings Tynita K
Current Estimated Value
Home Financials for this Owner
Home Financials are based on the most recent Mortgage that was taken out on this home.
Original Mortgage
$130,000
Outstanding Balance
$111,441
Interest Rate
3.9%
Mortgage Type
New Conventional
Estimated Equity
$91,555
Purchase Details
Closed on
Apr 15, 2015
Sold by
Town Of Hurlock
Bought by
Habitat For Humanity Choptank Inc
Purchase Details
Closed on
May 5, 2014
Sold by
Straight Line Construction Services Inc
Bought by
Dorchester County Maryland
Purchase Details
Closed on
Dec 1, 2005
Sold by
Ever & Sun Family Home Building Inc
Bought by
Straigh Services Inc
Purchase Details
Closed on
Nov 30, 2005
Sold by
Ever & Sun Family Home Building Inc
Bought by
Straigh Services Inc
Create a Home Valuation Report for This Property
The Home Valuation Report is an in-depth analysis detailing your home's value as well as a comparison with similar homes in the area
Home Values in the Area
Average Home Value in this Area
Purchase History
| Date | Buyer | Sale Price | Title Company |
|---|---|---|---|
| Cummings Tynita K | $130,000 | Venture Title Co Llc | |
| Habitat For Humanity Choptank Inc | -- | Venture Title Company | |
| Dorchester County Maryland | $985 | None Available | |
| Straigh Services Inc | $49,900 | -- | |
| Straigh Services Inc | $49,900 | -- |
Source: Public Records
Mortgage History
| Date | Status | Borrower | Loan Amount |
|---|---|---|---|
| Open | Cummings Tynita K | $130,000 |
Source: Public Records
Tax History
| Year | Tax Paid | Tax Assessment Tax Assessment Total Assessment is a certain percentage of the fair market value that is determined by local assessors to be the total taxable value of land and additions on the property. | Land | Improvement |
|---|---|---|---|---|
| 2025 | $2,891 | $167,200 | $0 | $0 |
| 2024 | $2,643 | $155,700 | $26,600 | $129,100 |
| 2023 | $2,643 | $147,867 | $0 | $0 |
| 2022 | $5,101 | $140,033 | $0 | $0 |
| 2021 | $2,421 | $132,200 | $21,600 | $110,600 |
| 2020 | $2,421 | $130,600 | $0 | $0 |
| 2019 | $2,391 | $129,000 | $0 | $0 |
| 2018 | $2,359 | $127,400 | $21,600 | $105,800 |
| 2017 | $1,115 | $130,867 | $0 | $0 |
| 2016 | -- | $18,600 | $0 | $0 |
| 2015 | $479 | $19,100 | $0 | $0 |
| 2014 | $479 | $19,100 | $0 | $0 |
Source: Public Records
Map
Nearby Homes
- 406 Charles St
- 101 Thompson St
- 311 Prospect St
- 309 S Main St
- 219 S Main St
- 207 S Main St
- 101 Commerce St
- 405 Collins Ave
- 521 Academy St
- 4715 Petersburg Back St
- 5907 Jeans Dr
- 6132 Palmer Mill Rd
- 4445 Rolling Acres Dr
- 0 Gravel Branch Rd Unit MDDO2001942
- 6720 Bobtown Rd
- 6749 Bobtown Rd
- 4907 Payne Rd
- 4714 Payne Rd
- 6009 Circle Dr
- 4604 Payne Rd
Your Personal Tour Guide
Ask me questions while you tour the home.