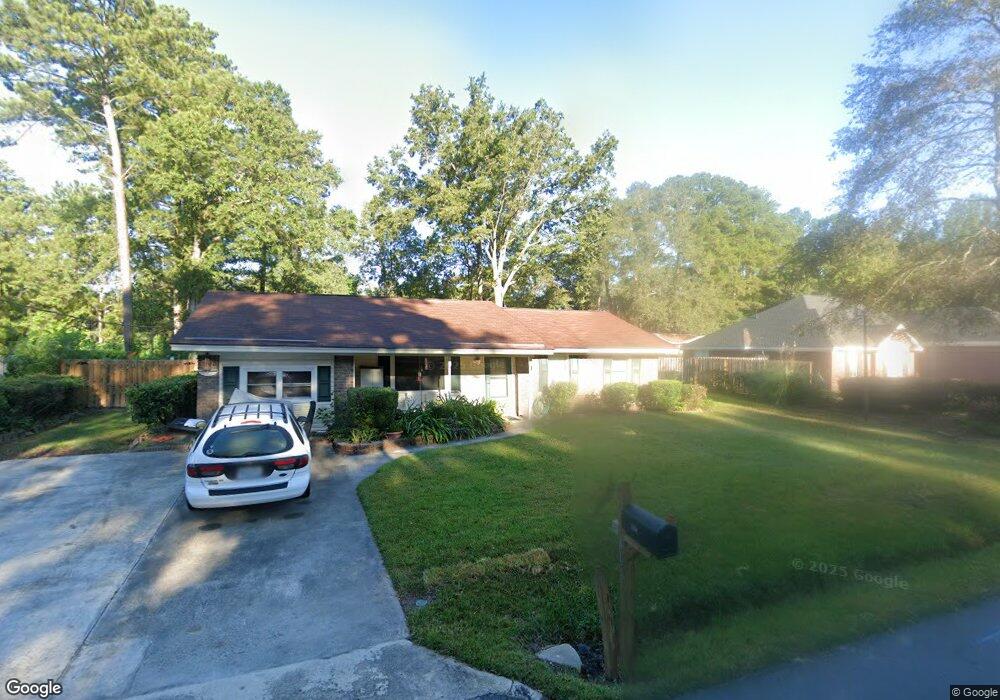
409 1st St Pooler, GA 31322
Estimated Value: $265,866 - $287,000
3
Beds
2
Baths
1,480
Sq Ft
$190/Sq Ft
Est. Value
About This Home
This home is located at 409 1st St, Pooler, GA 31322 and is currently estimated at $280,467, approximately $189 per square foot. 409 1st St is a home located in Chatham County with nearby schools including Pooler Elementary School, West Chatham Middle School, and Groves High School.
Ownership History
Date
Name
Owned For
Owner Type
Purchase Details
Closed on
May 29, 2013
Sold by
Webel Walter
Bought by
Webel Walter and Webel Mylinda
Current Estimated Value
Purchase Details
Closed on
Dec 21, 2012
Sold by
Webel Mylinda
Bought by
Webel Walter
Create a Home Valuation Report for This Property
The Home Valuation Report is an in-depth analysis detailing your home's value as well as a comparison with similar homes in the area
Home Values in the Area
Average Home Value in this Area
Purchase History
| Date | Buyer | Sale Price | Title Company |
|---|---|---|---|
| Webel Walter | -- | -- | |
| Webel Walter | -- | -- |
Source: Public Records
Tax History Compared to Growth
Tax History
| Year | Tax Paid | Tax Assessment Tax Assessment Total Assessment is a certain percentage of the fair market value that is determined by local assessors to be the total taxable value of land and additions on the property. | Land | Improvement |
|---|---|---|---|---|
| 2025 | $1,180 | $87,160 | $32,000 | $55,160 |
| 2024 | $1,180 | $68,880 | $24,000 | $44,880 |
| 2023 | $575 | $63,200 | $14,000 | $49,200 |
| 2022 | $1,088 | $58,360 | $14,000 | $44,360 |
| 2021 | $1,092 | $46,040 | $8,000 | $38,040 |
| 2020 | $1,066 | $45,880 | $8,000 | $37,880 |
| 2019 | $1,066 | $48,880 | $8,000 | $40,880 |
| 2018 | $1,052 | $44,120 | $8,000 | $36,120 |
| 2017 | $950 | $45,080 | $8,000 | $37,080 |
| 2016 | $938 | $45,320 | $8,000 | $37,320 |
| 2015 | $938 | $49,960 | $12,000 | $37,960 |
| 2014 | $1,369 | $50,760 | $0 | $0 |
Source: Public Records
Map
Nearby Homes