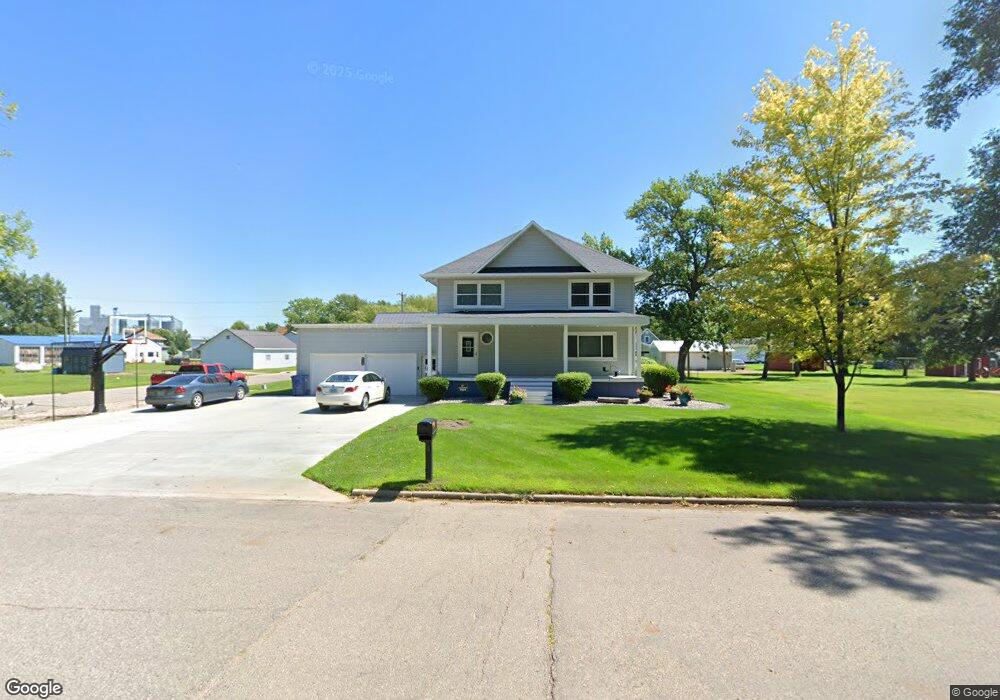
409 4th St Wyndmere, ND 58081
Estimated Value: $186,000 - $260,670
3
Beds
3
Baths
1,728
Sq Ft
$127/Sq Ft
Est. Value
About This Home
This home is located at 409 4th St, Wyndmere, ND 58081 and is currently estimated at $219,168, approximately $126 per square foot. 409 4th St is a home located in Richland County with nearby schools including Wyndmere Elementary School and Wyndmere High School.
Ownership History
Date
Name
Owned For
Owner Type
Purchase Details
Closed on
Mar 26, 2008
Sold by
Thompson Matthew W and Thompson Georgia
Bought by
Bernard Jamie C and Bernard Kara
Current Estimated Value
Home Financials for this Owner
Home Financials are based on the most recent Mortgage that was taken out on this home.
Original Mortgage
$92,150
Interest Rate
6.32%
Mortgage Type
New Conventional
Create a Home Valuation Report for This Property
The Home Valuation Report is an in-depth analysis detailing your home's value as well as a comparison with similar homes in the area
Purchase History
| Date | Buyer | Sale Price | Title Company |
|---|---|---|---|
| Bernard Jamie C | $95,000 | None Available |
Source: Public Records
Mortgage History
| Date | Status | Borrower | Loan Amount |
|---|---|---|---|
| Closed | Bernard Jamie C | $92,150 |
Source: Public Records
Tax History
| Year | Tax Paid | Tax Assessment Tax Assessment Total Assessment is a certain percentage of the fair market value that is determined by local assessors to be the total taxable value of land and additions on the property. | Land | Improvement |
|---|---|---|---|---|
| 2024 | $2,865 | $107,000 | $3,750 | $103,250 |
| 2023 | $2,719 | $105,300 | $3,750 | $101,550 |
| 2022 | $2,200 | $86,750 | $3,750 | $83,000 |
| 2021 | $2,479 | $80,100 | $2,550 | $77,550 |
| 2020 | $2,367 | $74,200 | $2,400 | $71,800 |
| 2019 | $2,393 | $74,200 | $2,400 | $71,800 |
| 2018 | $2,432 | $72,100 | $1,600 | $70,500 |
| 2017 | $2,288 | $62,600 | $1,500 | $61,100 |
| 2016 | $1,462 | $62,600 | $1,500 | $61,100 |
| 2015 | -- | $5,634 | $0 | $0 |
| 2014 | -- | $5,634 | $0 | $0 |
| 2013 | -- | $5,634 | $0 | $0 |
Source: Public Records
Map
Nearby Homes
Your Personal Tour Guide
Ask me questions while you tour the home.