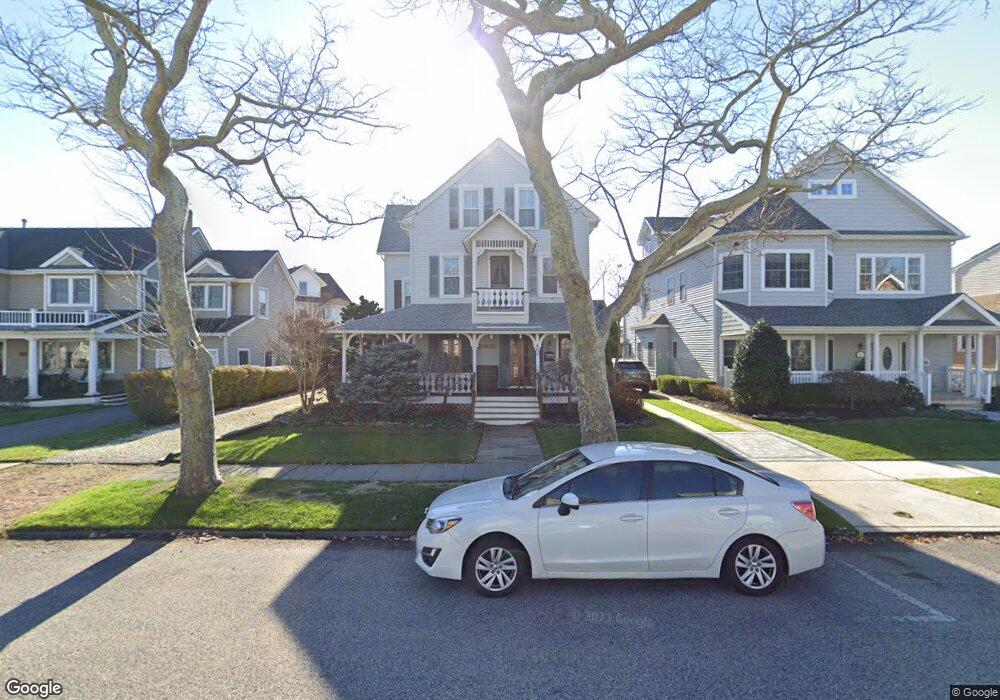
409 6th Ave Belmar, NJ 07719
Estimated Value: $1,382,000 - $1,817,000
4
Beds
3
Baths
2,535
Sq Ft
$627/Sq Ft
Est. Value
About This Home
This home is located at 409 6th Ave, Belmar, NJ 07719 and is currently estimated at $1,589,341, approximately $626 per square foot. 409 6th Ave is a home located in Monmouth County with nearby schools including Belmar Elementary School, St. Rose Grammar School, and St Rose High School.
Ownership History
Date
Name
Owned For
Owner Type
Purchase Details
Closed on
Dec 15, 2017
Sold by
Gahan Patrica
Bought by
Gahan Patrica and Raffrey Kelly
Current Estimated Value
Home Financials for this Owner
Home Financials are based on the most recent Mortgage that was taken out on this home.
Original Mortgage
$265,000
Outstanding Balance
$222,934
Interest Rate
3.91%
Mortgage Type
New Conventional
Estimated Equity
$1,366,407
Purchase Details
Closed on
Apr 19, 2006
Sold by
Gahan Kevin
Bought by
Gahan Patricia
Create a Home Valuation Report for This Property
The Home Valuation Report is an in-depth analysis detailing your home's value as well as a comparison with similar homes in the area
Home Values in the Area
Average Home Value in this Area
Purchase History
| Date | Buyer | Sale Price | Title Company |
|---|---|---|---|
| Gahan Patrica | -- | -- | |
| Gahan Patricia | -- | -- |
Source: Public Records
Mortgage History
| Date | Status | Borrower | Loan Amount |
|---|---|---|---|
| Open | Gahan Patrica | $265,000 |
Source: Public Records
Tax History Compared to Growth
Tax History
| Year | Tax Paid | Tax Assessment Tax Assessment Total Assessment is a certain percentage of the fair market value that is determined by local assessors to be the total taxable value of land and additions on the property. | Land | Improvement |
|---|---|---|---|---|
| 2025 | $10,834 | $744,600 | $550,000 | $194,600 |
| 2024 | $10,469 | $744,600 | $550,000 | $194,600 |
| 2023 | $10,469 | $744,600 | $550,000 | $194,600 |
| 2022 | $3,290 | $744,600 | $550,000 | $194,600 |
| 2021 | $3,290 | $744,600 | $550,000 | $194,600 |
| 2020 | $10,015 | $744,600 | $550,000 | $194,600 |
| 2019 | $10,015 | $744,600 | $550,000 | $194,600 |
| 2018 | $9,196 | $744,600 | $550,000 | $194,600 |
| 2017 | $8,972 | $744,600 | $550,000 | $194,600 |
| 2016 | $8,838 | $462,500 | $260,000 | $202,500 |
| 2015 | $8,492 | $442,500 | $240,000 | $202,500 |
| 2014 | $8,175 | $422,500 | $220,000 | $202,500 |
Source: Public Records
Map
Nearby Homes