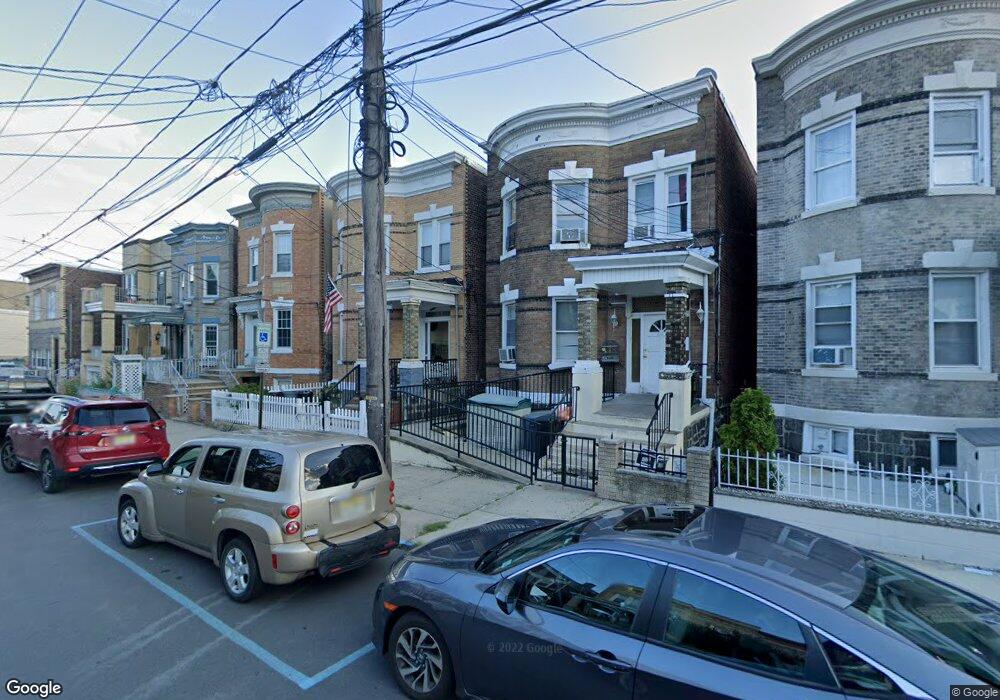
409 71st St North Bergen, NJ 07047
Estimated Value: $673,000 - $961,000
3
Beds
1
Bath
2,248
Sq Ft
$368/Sq Ft
Est. Value
About This Home
This home is located at 409 71st St, North Bergen, NJ 07047 and is currently estimated at $826,976, approximately $367 per square foot. 409 71st St is a home located in Hudson County with nearby schools including North Bergen High School and St. Joseph of the Palisades Elementary School.
Ownership History
Date
Name
Owned For
Owner Type
Purchase Details
Closed on
Apr 11, 2012
Sold by
Howard Derrick
Bought by
Arzuaga Betty and Arzuaga Irisaran
Current Estimated Value
Home Financials for this Owner
Home Financials are based on the most recent Mortgage that was taken out on this home.
Original Mortgage
$277,775
Interest Rate
3.87%
Mortgage Type
FHA
Purchase Details
Closed on
May 25, 2000
Sold by
Wortche Martha
Bought by
Caba Angel and Guzman Narzarie
Purchase Details
Closed on
Sep 22, 1997
Sold by
Sciancalepore Pasquale N and Sciancalepore Barbara A
Bought by
Howard Derrick
Home Financials for this Owner
Home Financials are based on the most recent Mortgage that was taken out on this home.
Original Mortgage
$144,172
Interest Rate
7.48%
Mortgage Type
FHA
Create a Home Valuation Report for This Property
The Home Valuation Report is an in-depth analysis detailing your home's value as well as a comparison with similar homes in the area
Home Values in the Area
Average Home Value in this Area
Purchase History
| Date | Buyer | Sale Price | Title Company |
|---|---|---|---|
| Arzuaga Betty | $285,000 | None Available | |
| Caba Angel | $160,000 | -- | |
| Howard Derrick | $148,000 | First American Title Ins Co |
Source: Public Records
Mortgage History
| Date | Status | Borrower | Loan Amount |
|---|---|---|---|
| Previous Owner | Arzuaga Betty | $277,775 | |
| Previous Owner | Howard Derrick | $144,172 |
Source: Public Records
Tax History Compared to Growth
Tax History
| Year | Tax Paid | Tax Assessment Tax Assessment Total Assessment is a certain percentage of the fair market value that is determined by local assessors to be the total taxable value of land and additions on the property. | Land | Improvement |
|---|---|---|---|---|
| 2025 | $11,418 | $653,600 | $330,000 | $323,600 |
| 2024 | $10,641 | $653,600 | $330,000 | $323,600 |
| 2023 | $10,641 | $653,600 | $330,000 | $323,600 |
| 2022 | $10,320 | $653,600 | $330,000 | $323,600 |
| 2021 | $9,218 | $157,500 | $60,000 | $97,500 |
| 2020 | $9,028 | $157,500 | $60,000 | $97,500 |
| 2019 | $9,018 | $157,500 | $60,000 | $97,500 |
| 2018 | $8,877 | $157,500 | $60,000 | $97,500 |
| 2017 | $8,711 | $157,500 | $60,000 | $97,500 |
| 2016 | $8,611 | $157,500 | $60,000 | $97,500 |
| 2015 | $8,333 | $157,500 | $60,000 | $97,500 |
| 2014 | $8,253 | $157,500 | $60,000 | $97,500 |
Source: Public Records
Map
Nearby Homes