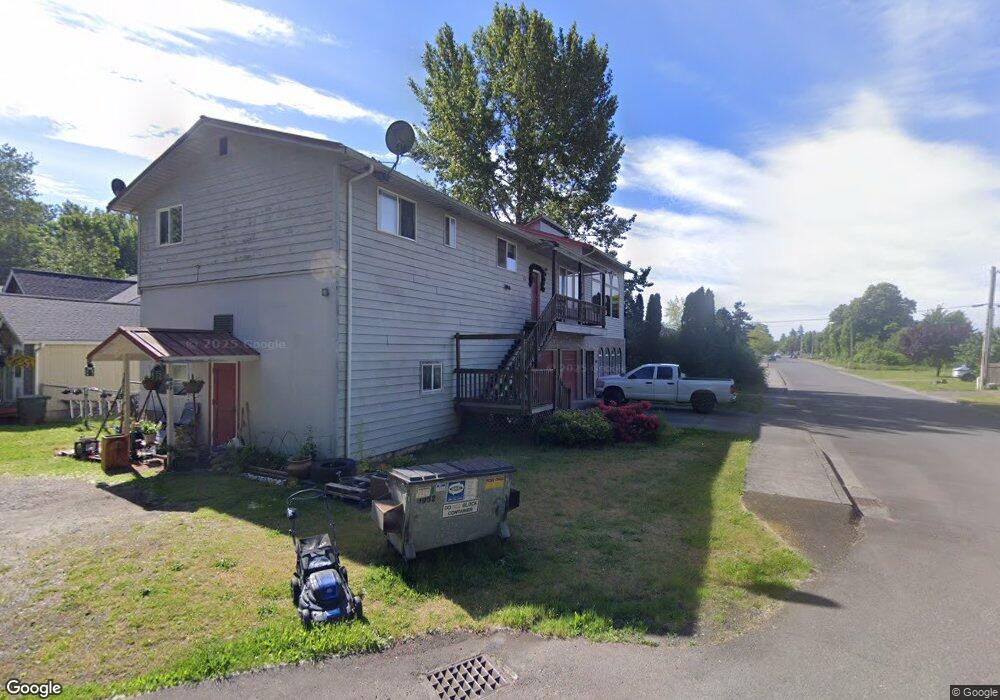
409 A St Blaine, WA 98230
Estimated Value: $642,000 - $737,000
3
Beds
3
Baths
2,387
Sq Ft
$290/Sq Ft
Est. Value
About This Home
This home is located at 409 A St, Blaine, WA 98230 and is currently estimated at $691,673, approximately $289 per square foot. 409 A St is a home located in Whatcom County with nearby schools including Blaine Primary School, Blaine Elementary School, and Blaine Middle School.
Ownership History
Date
Name
Owned For
Owner Type
Purchase Details
Closed on
Oct 21, 2016
Sold by
Dalgliesh Thomas T and Dalgliesh Penny J
Bought by
Dhudwal Harjinder Singh and Dhudwal Kulwant Kaur
Current Estimated Value
Purchase Details
Closed on
Oct 29, 2009
Sold by
Sullivan Colleen E
Bought by
Dalgliesh Thomas T and Dalgliesh Penny J
Home Financials for this Owner
Home Financials are based on the most recent Mortgage that was taken out on this home.
Original Mortgage
$194,250
Interest Rate
5%
Mortgage Type
New Conventional
Purchase Details
Closed on
Apr 15, 2005
Sold by
Blaine Cold Storage Llc
Bought by
Sullivan Colleen E
Home Financials for this Owner
Home Financials are based on the most recent Mortgage that was taken out on this home.
Original Mortgage
$252,000
Interest Rate
6.87%
Mortgage Type
Purchase Money Mortgage
Create a Home Valuation Report for This Property
The Home Valuation Report is an in-depth analysis detailing your home's value as well as a comparison with similar homes in the area
Home Values in the Area
Average Home Value in this Area
Purchase History
| Date | Buyer | Sale Price | Title Company |
|---|---|---|---|
| Dhudwal Harjinder Singh | $337,489 | Chicago Title Insurance | |
| Dalgliesh Thomas T | $259,280 | Stewart Title Company | |
| Sullivan Colleen E | $315,000 | Chicago Title Insurance |
Source: Public Records
Mortgage History
| Date | Status | Borrower | Loan Amount |
|---|---|---|---|
| Previous Owner | Dalgliesh Thomas T | $194,250 | |
| Previous Owner | Sullivan Colleen E | $252,000 | |
| Closed | Sullivan Colleen E | $47,250 |
Source: Public Records
Tax History Compared to Growth
Tax History
| Year | Tax Paid | Tax Assessment Tax Assessment Total Assessment is a certain percentage of the fair market value that is determined by local assessors to be the total taxable value of land and additions on the property. | Land | Improvement |
|---|---|---|---|---|
| 2024 | $4,777 | $709,744 | $166,500 | $543,244 |
| 2023 | $4,777 | $709,744 | $166,500 | $543,244 |
| 2022 | $4,256 | $639,409 | $150,000 | $489,409 |
| 2021 | $4,059 | $487,644 | $123,855 | $363,789 |
| 2020 | $3,862 | $424,038 | $107,700 | $316,338 |
| 2019 | $3,597 | $388,308 | $98,625 | $289,683 |
| 2018 | $3,342 | $352,873 | $89,625 | $263,248 |
| 2017 | $2,980 | $295,291 | $75,000 | $220,291 |
| 2016 | $2,690 | $295,291 | $75,000 | $220,291 |
| 2015 | $2,636 | $257,146 | $44,163 | $212,983 |
| 2014 | -- | $246,081 | $42,262 | $203,819 |
| 2013 | -- | $243,398 | $41,800 | $201,598 |
Source: Public Records
Map
Nearby Homes