Estimated Value: $75,000 - $125,000
4
Beds
1
Bath
1,658
Sq Ft
$60/Sq Ft
Est. Value
About This Home
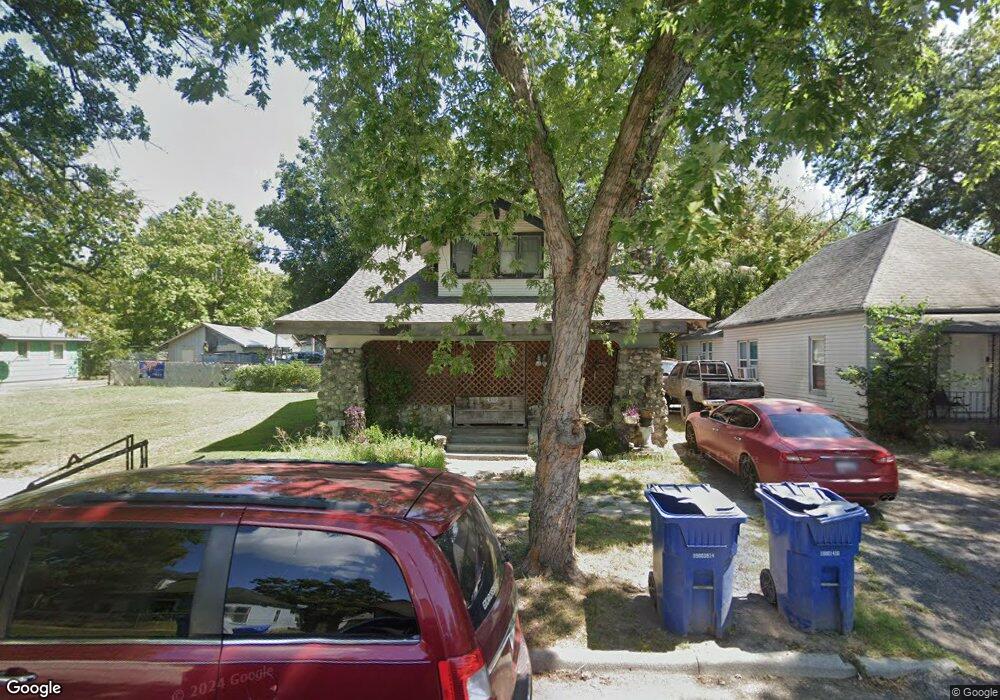
This home is located at 409 A St SE, Miami, OK 74354 and is currently estimated at $99,667, approximately $60 per square foot. 409 A St SE is a home located in Ottawa County with nearby schools including Miami High School and Mt. Olive Lutheran School.
Ownership History
Date
Name
Owned For
Owner Type
Purchase Details
Closed on
Mar 28, 2023
Sold by
Smith Barbara A
Bought by
Slaton Catherine
Current Estimated Value
Purchase Details
Closed on
Nov 18, 2011
Sold by
Ferris Kenneth W and Ferris Verna L
Bought by
Smith John L and Smith Barbara A
Home Financials for this Owner
Home Financials are based on the most recent Mortgage that was taken out on this home.
Original Mortgage
$43,371
Interest Rate
4.75%
Mortgage Type
FHA
Purchase Details
Closed on
Apr 8, 2010
Sold by
Secretary Of Hud
Bought by
Ferris Kenneth W and Ferris Verna L
Purchase Details
Closed on
Apr 19, 2006
Sold by
Crabough Frieda Colleen Denney
Bought by
Rudolph Michael M
Home Financials for this Owner
Home Financials are based on the most recent Mortgage that was taken out on this home.
Original Mortgage
$58,675
Interest Rate
6.32%
Mortgage Type
FHA
Create a Home Valuation Report for This Property
The Home Valuation Report is an in-depth analysis detailing your home's value as well as a comparison with similar homes in the area
Home Values in the Area
Average Home Value in this Area
Purchase History
| Date | Buyer | Sale Price | Title Company |
|---|---|---|---|
| Slaton Catherine | -- | -- | |
| Smith John L | $8,666 | None Available | |
| Ferris Kenneth W | -- | None Available | |
| Rudolph Michael M | $59,500 | None Available |
Source: Public Records
Mortgage History
| Date | Status | Borrower | Loan Amount |
|---|---|---|---|
| Previous Owner | Smith John L | $43,371 | |
| Previous Owner | Rudolph Michael M | $58,675 |
Source: Public Records
Tax History Compared to Growth
Tax History
| Year | Tax Paid | Tax Assessment Tax Assessment Total Assessment is a certain percentage of the fair market value that is determined by local assessors to be the total taxable value of land and additions on the property. | Land | Improvement |
|---|---|---|---|---|
| 2025 | $805 | $7,425 | $513 | $6,912 |
| 2024 | $805 | $8,354 | $513 | $7,841 |
| 2023 | $805 | $8,263 | $513 | $7,750 |
| 2022 | $727 | $7,869 | $513 | $7,356 |
| 2021 | $708 | $7,495 | $513 | $6,982 |
| 2020 | $680 | $7,138 | $513 | $6,625 |
| 2019 | $558 | $6,798 | $513 | $6,285 |
| 2018 | $535 | $6,474 | $513 | $5,961 |
| 2017 | $518 | $6,166 | $513 | $5,653 |
| 2016 | $472 | $5,872 | $513 | $5,359 |
| 2015 | $164 | $1,841 | $310 | $1,531 |
| 2014 | $458 | $5,593 | $513 | $5,080 |
Source: Public Records
Map
Nearby Homes