Estimated Value: $363,521 - $426,000
3
Beds
2
Baths
2,210
Sq Ft
$179/Sq Ft
Est. Value
About This Home
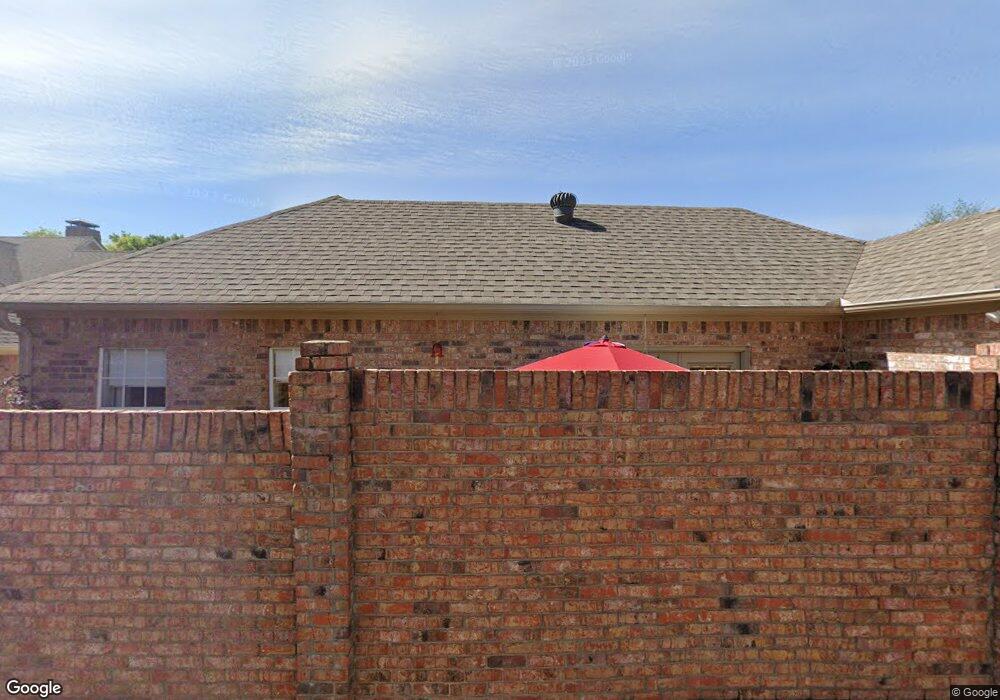
This home is located at 409 Brighton Ct, Tyler, TX 75701 and is currently estimated at $395,507, approximately $178 per square foot. 409 Brighton Ct is a home located in Smith County with nearby schools including Woods Elementary School, Hubbard Middle School, and Tyler Legacy High School.
Ownership History
Date
Name
Owned For
Owner Type
Purchase Details
Closed on
Oct 7, 2022
Sold by
Truly Josephine M
Bought by
Macdonald Timothy Robert and Macdonald Lynette Warthen
Current Estimated Value
Purchase Details
Closed on
May 23, 2013
Sold by
Beard Ty
Bought by
Truly Josephine M
Home Financials for this Owner
Home Financials are based on the most recent Mortgage that was taken out on this home.
Original Mortgage
$178,000
Interest Rate
3.45%
Mortgage Type
New Conventional
Purchase Details
Closed on
Sep 6, 2012
Sold by
Beard Ty
Bought by
Beard Ty and Martin Childrens Trust
Purchase Details
Closed on
May 11, 2011
Sold by
Martin Lori Lynne
Bought by
Beard Ty and Lori Martin Residence Trust
Purchase Details
Closed on
Jun 25, 2010
Sold by
Duncan Ann Herring and Herring Maxwell
Bought by
Martin Lori Lynne
Create a Home Valuation Report for This Property
The Home Valuation Report is an in-depth analysis detailing your home's value as well as a comparison with similar homes in the area
Purchase History
| Date | Buyer | Sale Price | Title Company |
|---|---|---|---|
| Macdonald Timothy Robert | -- | -- | |
| Truly Josephine M | -- | None Available | |
| Beard Ty | -- | None Available | |
| Beard Ty | -- | None Available | |
| Martin Lori Lynne | -- | Htc | |
| Martin Lori Lynne | -- | Htc |
Source: Public Records
Mortgage History
| Date | Status | Borrower | Loan Amount |
|---|---|---|---|
| Previous Owner | Truly Josephine M | $178,000 |
Source: Public Records
Tax History
| Year | Tax Paid | Tax Assessment Tax Assessment Total Assessment is a certain percentage of the fair market value that is determined by local assessors to be the total taxable value of land and additions on the property. | Land | Improvement |
|---|---|---|---|---|
| 2025 | $6,826 | $401,255 | $42,715 | $358,540 |
| 2024 | $7,110 | $417,923 | $46,301 | $371,622 |
| 2023 | $6,307 | $361,838 | $46,301 | $315,537 |
| 2022 | $5,980 | $313,587 | $30,867 | $282,720 |
| 2021 | $5,822 | $277,500 | $30,867 | $246,633 |
| 2020 | $5,814 | $271,699 | $31,500 | $240,199 |
| 2019 | $5,805 | $265,468 | $31,500 | $233,968 |
| 2018 | $5,429 | $249,600 | $31,500 | $218,100 |
| 2017 | $5,273 | $249,600 | $31,500 | $218,100 |
| 2016 | $4,793 | $224,522 | $31,500 | $193,022 |
| 2015 | $3,547 | $218,215 | $31,500 | $186,715 |
| 2014 | $3,547 | $214,407 | $31,500 | $182,907 |
Source: Public Records
Map
Nearby Homes
- 410 Brighton Ct
- 406 Brighton Ct
- 504 Woodland Hills Dr
- 604-606 Woodland Hills Dr
- 612 Rosemont Place II
- 504 Hyde Park Dr
- 507 Hyde Park Dr
- 505 Buckingham Place
- 509 Buckingham Place
- 3820 S Donnybrook Ave
- 3613 Silverwood Dr
- 3500 Silverwood Dr
- 4031 Silverwood Dr
- 640 Beechwood Dr
- 3518 Cloverdale Dr
- 3501 Silverwood Dr
- 614 Zelwood Dr
- 811 Trenton Dr
- 418 Boyd Ln
- 3829 Cloverdale Dr
- 409 409 Brighton Ct
- 407 Brighton Ct
- 411 Brighton Ct
- 411 411 Brighton
- 411 411 Brighton Crt
- 405 Brighton Ct
- 413 Brighton Ct
- 414 Woodland Hills Dr
- 413 413 Brighton Ct
- 408 Brighton Ct
- 416 Woodland Hills Dr
- 410 Woodland Hills Dr
- 406 406 Brighton Ct
- 414 414 Brighton Ct
- 408 Woodland Hills Dr
- 408 408 Woodland Hills
- 418 Woodland Hills Dr
- 414 Brighton Ct
- 415 Brighton Ct
- 415 415 Brighton Ct
Your Personal Tour Guide
Ask me questions while you tour the home.