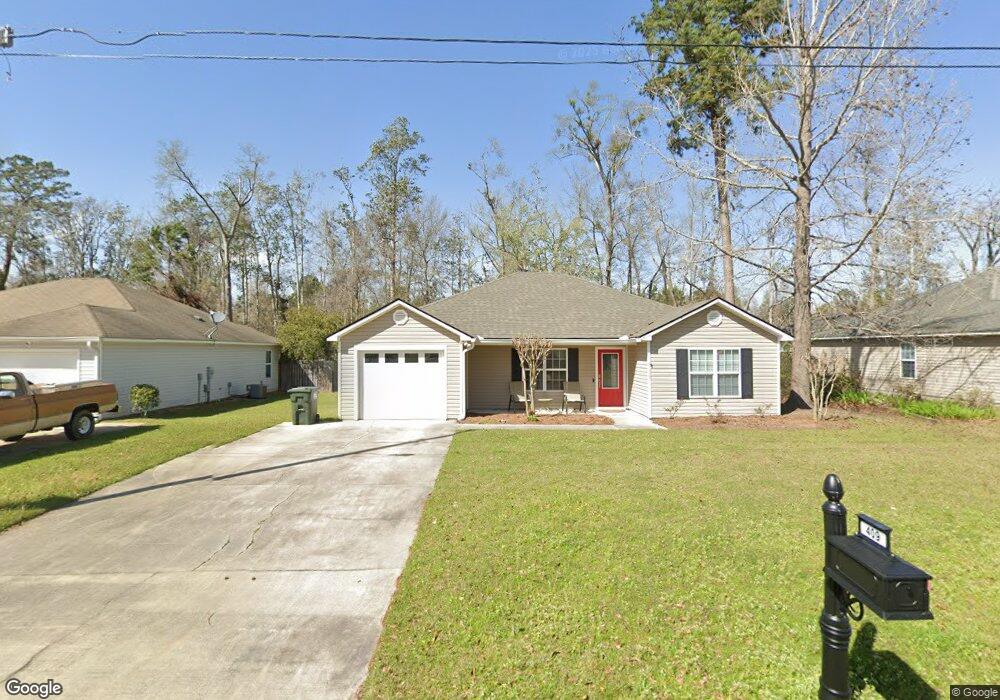
409 Bryson Cir Hahira, GA 31632
Estimated Value: $213,000 - $228,000
3
Beds
2
Baths
1,418
Sq Ft
$154/Sq Ft
Est. Value
About This Home
This home is located at 409 Bryson Cir, Hahira, GA 31632 and is currently estimated at $218,876, approximately $154 per square foot. 409 Bryson Cir is a home located in Lowndes County with nearby schools including Hahira Elementary School, Hahira Middle School, and Lowndes High School.
Ownership History
Date
Name
Owned For
Owner Type
Purchase Details
Closed on
Aug 26, 2020
Sold by
Huffman Linda
Bought by
Huffman David Thomas and Sharon Huffman Irrevocable Tr
Current Estimated Value
Purchase Details
Closed on
Feb 15, 2018
Sold by
Huffman Linda Sharon
Bought by
Huffman Linda and Huffman Batalia R
Purchase Details
Closed on
Nov 22, 2005
Sold by
Classic Homes By Weaver Inc
Bought by
Huffman David M and Huffman Linda
Home Financials for this Owner
Home Financials are based on the most recent Mortgage that was taken out on this home.
Original Mortgage
$109,394
Interest Rate
6.1%
Mortgage Type
New Conventional
Purchase Details
Closed on
Apr 8, 2005
Sold by
Nelco Inc
Bought by
Classic Homes By Weaver Inc
Home Financials for this Owner
Home Financials are based on the most recent Mortgage that was taken out on this home.
Original Mortgage
$397,500
Interest Rate
5.62%
Mortgage Type
New Conventional
Create a Home Valuation Report for This Property
The Home Valuation Report is an in-depth analysis detailing your home's value as well as a comparison with similar homes in the area
Home Values in the Area
Average Home Value in this Area
Purchase History
| Date | Buyer | Sale Price | Title Company |
|---|---|---|---|
| Huffman David Thomas | -- | -- | |
| Huffman Linda | -- | -- | |
| Huffman Linda | -- | -- | |
| Huffman David M | $105,900 | -- | |
| Classic Homes By Weaver Inc | $412,500 | -- |
Source: Public Records
Mortgage History
| Date | Status | Borrower | Loan Amount |
|---|---|---|---|
| Previous Owner | Huffman David M | $109,394 | |
| Previous Owner | Classic Homes By Weaver Inc | $397,500 |
Source: Public Records
Tax History Compared to Growth
Tax History
| Year | Tax Paid | Tax Assessment Tax Assessment Total Assessment is a certain percentage of the fair market value that is determined by local assessors to be the total taxable value of land and additions on the property. | Land | Improvement |
|---|---|---|---|---|
| 2024 | $1,815 | $74,826 | $10,000 | $64,826 |
| 2023 | $1,756 | $61,104 | $10,000 | $51,104 |
| 2022 | $1,218 | $44,016 | $10,000 | $34,016 |
| 2021 | $1,221 | $44,016 | $10,000 | $34,016 |
| 2020 | $1,139 | $40,924 | $10,000 | $30,924 |
| 2019 | $1,149 | $40,924 | $10,000 | $30,924 |
| 2018 | $1,158 | $40,924 | $10,000 | $30,924 |
| 2017 | $1,174 | $40,924 | $10,000 | $30,924 |
| 2016 | $1,208 | $41,880 | $10,000 | $31,880 |
| 2015 | -- | $41,880 | $10,000 | $31,880 |
| 2014 | $1,186 | $41,880 | $10,000 | $31,880 |
Source: Public Records
Map
Nearby Homes
- 819 Kristen Ln
- 824 Danielle Way
- 489 Bryson Cir
- 3001 Houser Way
- 1601 Beverly Ln
- 497 Bryson Cir
- The Belfort Plan at Phillips Place
- The Ozark Plan at Phillips Place
- 6680 Brookridge Dr
- 411 Judy Ann Dr
- 6672 Brookridge Dr
- 209 Orvis Ln
- 3033 Reynolda Dr
- 6628 Brookridge Dr
- 6622 Brookridge Dr
- 6616 Brookridge Dr
- 605 S Nelson St
- 6610 Brookridge Dr
- 750 Georgia 122
- 3021 Mary Powell Way