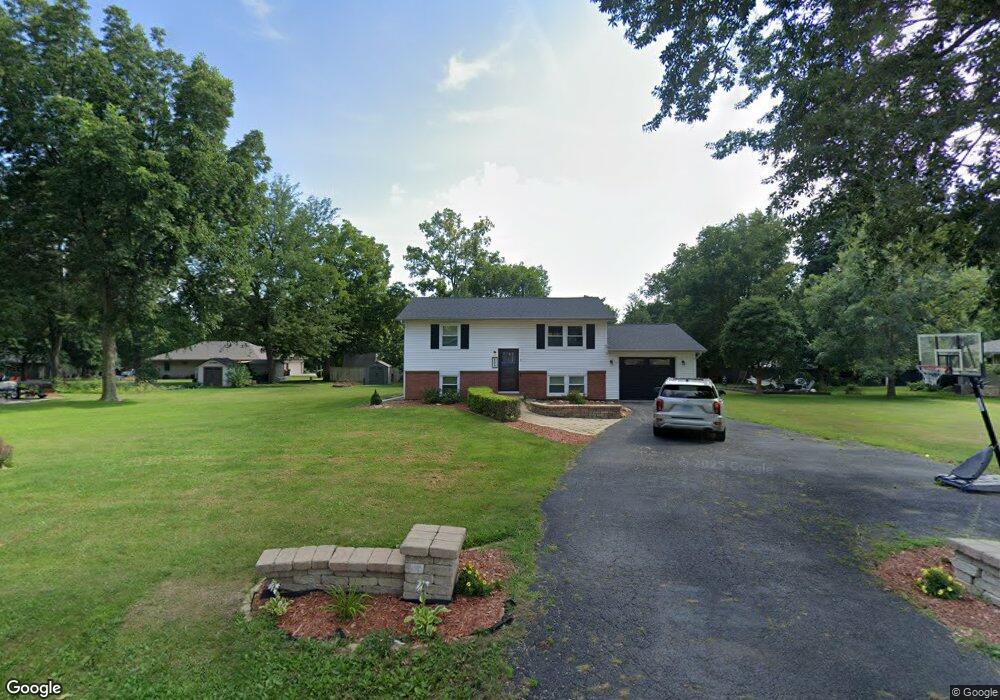
409 Buckles Grove Rd Le Roy, IL 61752
Estimated Value: $176,000 - $201,000
2
Beds
2
Baths
1,626
Sq Ft
$116/Sq Ft
Est. Value
About This Home
This home is located at 409 Buckles Grove Rd, Le Roy, IL 61752 and is currently estimated at $189,014, approximately $116 per square foot. 409 Buckles Grove Rd is a home located in McLean County with nearby schools including Le Roy Elementary School, Le Roy Junior High School, and Le Roy High School.
Ownership History
Date
Name
Owned For
Owner Type
Purchase Details
Closed on
Feb 14, 2012
Sold by
Hammer Donald
Bought by
Kinney Joshua and Kinney Laura
Current Estimated Value
Home Financials for this Owner
Home Financials are based on the most recent Mortgage that was taken out on this home.
Original Mortgage
$122,400
Outstanding Balance
$83,937
Interest Rate
3.91%
Estimated Equity
$105,077
Purchase Details
Closed on
Nov 4, 2010
Sold by
Warlow Richard K and Warlow Teresa
Bought by
Homesales Inc
Purchase Details
Closed on
Jun 28, 2004
Sold by
Tindall Ronald E and Tindall Roberta A
Bought by
Warlow Richard K and Warlow Teresa
Home Financials for this Owner
Home Financials are based on the most recent Mortgage that was taken out on this home.
Original Mortgage
$102,500
Interest Rate
5.7%
Create a Home Valuation Report for This Property
The Home Valuation Report is an in-depth analysis detailing your home's value as well as a comparison with similar homes in the area
Home Values in the Area
Average Home Value in this Area
Purchase History
| Date | Buyer | Sale Price | Title Company |
|---|---|---|---|
| Kinney Joshua | $120,000 | Mclean County Title | |
| Homesales Inc | -- | None Available | |
| Warlow Richard K | $98,500 | None Available |
Source: Public Records
Mortgage History
| Date | Status | Borrower | Loan Amount |
|---|---|---|---|
| Open | Kinney Joshua | $122,400 | |
| Previous Owner | Warlow Richard K | $102,500 |
Source: Public Records
Tax History Compared to Growth
Tax History
| Year | Tax Paid | Tax Assessment Tax Assessment Total Assessment is a certain percentage of the fair market value that is determined by local assessors to be the total taxable value of land and additions on the property. | Land | Improvement |
|---|---|---|---|---|
| 2024 | $3,609 | $59,834 | $4,935 | $54,899 |
| 2022 | $3,609 | $50,421 | $4,158 | $46,263 |
| 2021 | $3,455 | $47,979 | $3,957 | $44,022 |
| 2020 | $3,403 | $46,478 | $3,833 | $42,645 |
| 2019 | $3,352 | $46,478 | $3,833 | $42,645 |
| 2018 | $3,332 | $46,478 | $3,833 | $42,645 |
| 2017 | $3,357 | $46,815 | $3,861 | $42,954 |
| 2016 | $3,243 | $46,105 | $3,802 | $42,303 |
| 2015 | $3,143 | $44,784 | $3,693 | $41,091 |
| 2014 | $3,036 | $44,188 | $3,644 | $40,544 |
| 2013 | -- | $44,188 | $3,644 | $40,544 |
Source: Public Records
Map
Nearby Homes
- 108 Cardinal Dr
- 112 Fox Run Ct
- 114 Fox Run Ct
- 302 Mockingbird Ln
- 000 Lot 6 Sunset Dr
- 000 Lot 4 Sunset Dr
- 000 Lot 5 Sunset Dr
- 000 Lot 2 Sunset Dr
- 600 E Cedar St
- 26812 U S 150
- 110 W Green St
- 230-005 Wayne St
- 21027 Prairie Chapel Rd
- 52 Moss Dr
- 10 Moss Dr
- 11 Moss Dr
- 1000 Clinton Ave E
- 4 Moss Lake Rd
- 4397 N 3200 Rd E
- 50 Moss Lake Dr
- 410 Samuel Dr
- 407 Buckles Grove Rd
- 411 Buckles Grove Rd
- 404 Buckles Grove Rd
- 408 Samuel Dr
- 412 Samuel Dr
- 917 Taylor Ln
- 406 Buckles Grove Rd
- 915 Taylor Ln
- 910 Taylor Ln
- 405 Buckles Grove Rd
- 413 Buckles Grove Rd
- 913 Taylor Ln
- 908 Taylor Ln
- 406 Samuel Dr
- 400 Buckles Grove Rd
- 410 Buckles Grove Rd
- 911 Taylor Ln
- 407 Samuel Dr
- 409 Samuel Dr