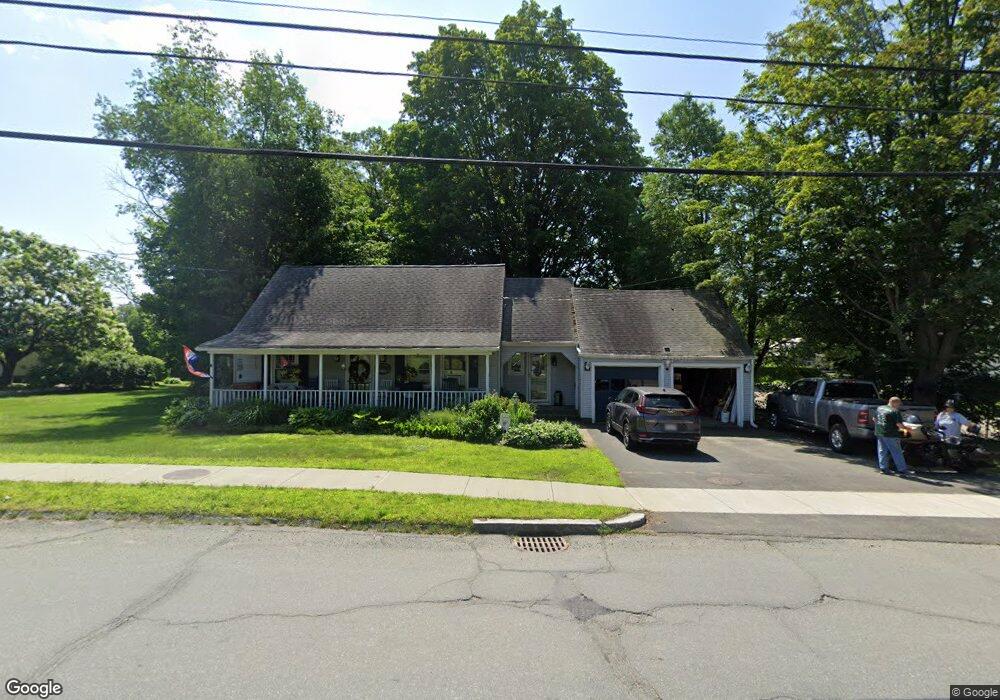
409 Chapman St Greenfield, MA 01301
Estimated Value: $306,000 - $369,000
2
Beds
1
Bath
1,472
Sq Ft
$232/Sq Ft
Est. Value
About This Home
This home is located at 409 Chapman St, Greenfield, MA 01301 and is currently estimated at $340,870, approximately $231 per square foot. 409 Chapman St is a home located in Franklin County with nearby schools including Cornerstone Christian School and Holy Trinity School.
Ownership History
Date
Name
Owned For
Owner Type
Purchase Details
Closed on
Jul 15, 1998
Sold by
Romero Kathy J and Romero Frank
Bought by
Claine John H and Claine Kimberly L
Current Estimated Value
Purchase Details
Closed on
Aug 20, 1992
Sold by
Russo Richard P and Russo Ann T
Bought by
Olanyk Kathy J and Romero Juan B
Create a Home Valuation Report for This Property
The Home Valuation Report is an in-depth analysis detailing your home's value as well as a comparison with similar homes in the area
Home Values in the Area
Average Home Value in this Area
Purchase History
| Date | Buyer | Sale Price | Title Company |
|---|---|---|---|
| Claine John H | $103,000 | -- | |
| Claine John H | $103,000 | -- | |
| Olanyk Kathy J | $106,000 | -- | |
| Olanyk Kathy J | $106,000 | -- |
Source: Public Records
Mortgage History
| Date | Status | Borrower | Loan Amount |
|---|---|---|---|
| Open | Olanyk Kathy J | $9,734 | |
| Open | Olanyk Kathy J | $198,734 |
Source: Public Records
Tax History
| Year | Tax Paid | Tax Assessment Tax Assessment Total Assessment is a certain percentage of the fair market value that is determined by local assessors to be the total taxable value of land and additions on the property. | Land | Improvement |
|---|---|---|---|---|
| 2025 | $6,570 | $335,900 | $64,900 | $271,000 |
| 2024 | $6,525 | $320,000 | $52,100 | $267,900 |
| 2023 | $5,846 | $297,500 | $52,100 | $245,400 |
| 2022 | $5,397 | $241,800 | $47,200 | $194,600 |
| 2021 | $5,004 | $215,500 | $46,800 | $168,700 |
| 2020 | $4,714 | $205,600 | $42,600 | $163,000 |
| 2019 | $4,472 | $200,000 | $37,000 | $163,000 |
| 2018 | $4,412 | $196,700 | $36,300 | $160,400 |
| 2017 | $4,274 | $196,700 | $36,300 | $160,400 |
| 2016 | $4,244 | $194,600 | $34,900 | $159,700 |
| 2015 | $4,275 | $189,900 | $39,100 | $150,800 |
| 2014 | $3,897 | $189,800 | $39,100 | $150,700 |
Source: Public Records
Map
Nearby Homes
- 171 Cleveland St
- 208 Silver St
- 37 Cleveland St
- 306 Country Side Rd
- 402 Country Side Rd
- 187 Leyden Rd
- 173-175 Conway St
- 159 Chapman St
- 59-61 Conway St
- 11 Conway St
- 11 Colrain St
- 52 Prospect St Unit A
- 13 River St
- 8 Water St
- 2 Water St
- 0 Marshall St
- 71 Washington St
- 73 Washington St
- 23 Robbins Rd
- 77 Washington St
- 292 Silver St
- 292 Silver St
- 0 Silver St
- 410 Chapman St
- 410 Chapman St
- 288 Silver St
- 141 Cleveland St
- 110 Vernon St
- 295 Silver St
- 293 Silver St
- 291 Silver St
- 6 Silver Crest St
- 104 Vernon St
- 284 Silver St
- 289 Silver St
- 289 Silver St
- 289 Silver St Unit 2B
- 135 Cleveland St
- 287 Silver St
- 287 Silver St Unit 287-289
Your Personal Tour Guide
Ask me questions while you tour the home.