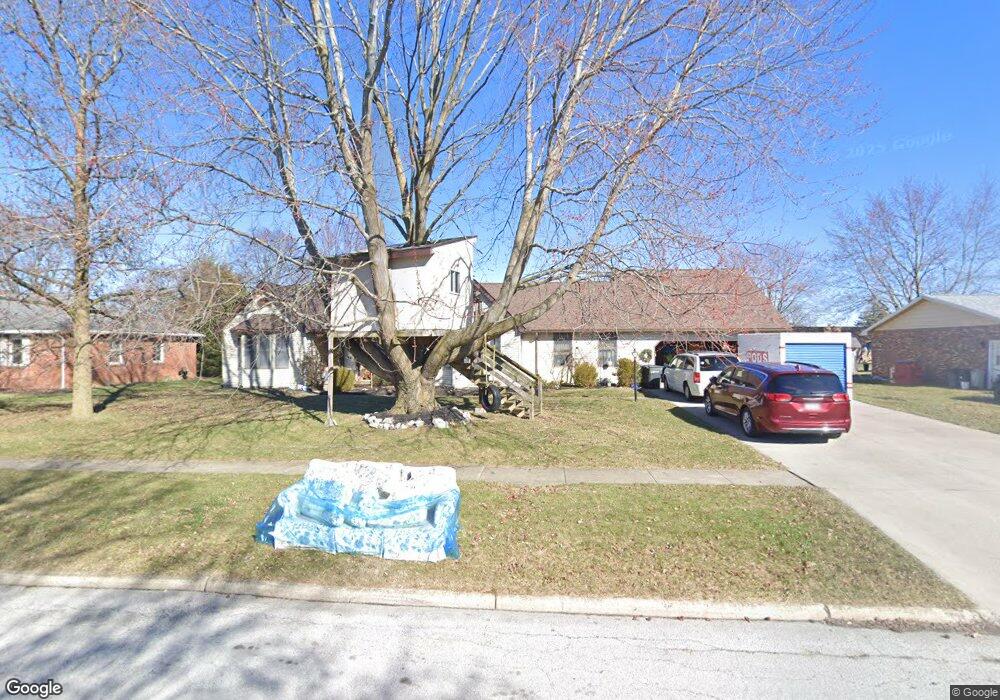
409 Chase Rd Findlay, OH 45840
Estimated Value: $298,000 - $327,401
3
Beds
3
Baths
1,982
Sq Ft
$158/Sq Ft
Est. Value
About This Home
This home is located at 409 Chase Rd, Findlay, OH 45840 and is currently estimated at $312,600, approximately $157 per square foot. 409 Chase Rd is a home located in Hancock County with nearby schools including Wilson Vance Elementary School, Whittier Elementary School, and Donnell Middle School.
Ownership History
Date
Name
Owned For
Owner Type
Purchase Details
Closed on
May 12, 2008
Sold by
Macke Stanley L
Bought by
Nagy Timothy and Wooden Nagy Erin
Current Estimated Value
Home Financials for this Owner
Home Financials are based on the most recent Mortgage that was taken out on this home.
Original Mortgage
$170,000
Outstanding Balance
$107,941
Interest Rate
5.93%
Mortgage Type
Purchase Money Mortgage
Estimated Equity
$204,659
Purchase Details
Closed on
Apr 18, 2007
Sold by
Macke Stanley L
Bought by
Nagy Timothy and Nagy Erin
Home Financials for this Owner
Home Financials are based on the most recent Mortgage that was taken out on this home.
Original Mortgage
$165,000
Interest Rate
5.74%
Mortgage Type
Seller Take Back
Purchase Details
Closed on
Mar 31, 1987
Bought by
Macke Stanley L and Macke Jennifer
Create a Home Valuation Report for This Property
The Home Valuation Report is an in-depth analysis detailing your home's value as well as a comparison with similar homes in the area
Home Values in the Area
Average Home Value in this Area
Purchase History
| Date | Buyer | Sale Price | Title Company |
|---|---|---|---|
| Nagy Timothy | $192,000 | Golden Key | |
| Nagy Timothy | $175,000 | None Available | |
| Macke Stanley L | $16,000 | -- |
Source: Public Records
Mortgage History
| Date | Status | Borrower | Loan Amount |
|---|---|---|---|
| Open | Nagy Timothy | $170,000 | |
| Previous Owner | Nagy Timothy | $165,000 |
Source: Public Records
Tax History
| Year | Tax Paid | Tax Assessment Tax Assessment Total Assessment is a certain percentage of the fair market value that is determined by local assessors to be the total taxable value of land and additions on the property. | Land | Improvement |
|---|---|---|---|---|
| 2024 | $2,855 | $80,380 | $13,090 | $67,290 |
| 2023 | $2,860 | $80,380 | $13,090 | $67,290 |
| 2022 | $2,850 | $80,380 | $13,090 | $67,290 |
| 2021 | $2,737 | $67,240 | $12,620 | $54,620 |
| 2020 | $2,736 | $67,240 | $12,620 | $54,620 |
| 2019 | $2,681 | $67,240 | $12,620 | $54,620 |
| 2018 | $2,477 | $56,990 | $11,470 | $45,520 |
| 2017 | $2,478 | $56,990 | $11,470 | $45,520 |
| 2016 | $2,441 | $56,990 | $11,470 | $45,520 |
| 2015 | $2,918 | $66,730 | $10,010 | $56,720 |
| 2014 | $2,918 | $66,730 | $10,010 | $56,720 |
| 2012 | $2,937 | $66,730 | $10,010 | $56,720 |
Source: Public Records
Map
Nearby Homes
- 1421 E Sandusky St
- 1421 Autumn Dr
- 309 Huron Rd
- 1001 Decker Ave
- 1200 1st St
- 1037 Fishlock Ave
- 15591 Canadian Way
- 15586 Canadian Way
- 15615 Canadian Way
- 1020 Country Club Dr
- 401 Westchester Dr
- 1521 Middle Ct
- 707 Winterhaven Dr
- 1308 Greendale Ave
- 1825 Greendale Ave
- 2000 Rush Creek Ct
- 439 Carnahan Ave
- 640 Center St
- 0 Blanchard Ave
- 542 Bright Rd
Your Personal Tour Guide
Ask me questions while you tour the home.