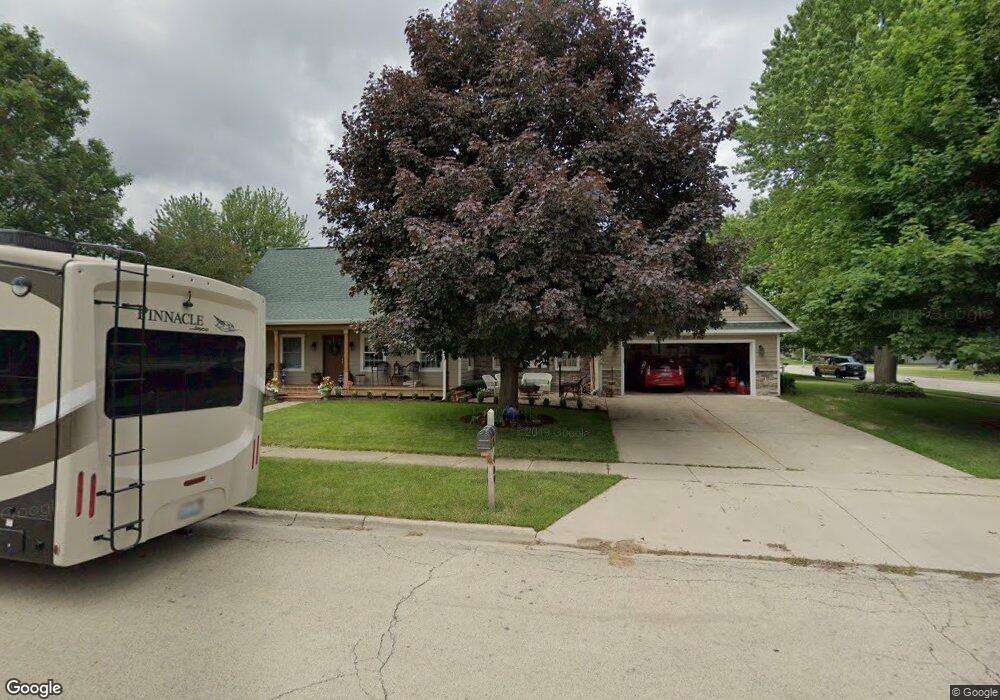
409 Conlin Ave Sycamore, IL 60178
Estimated Value: $383,000
4
Beds
2
Baths
2,700
Sq Ft
$142/Sq Ft
Est. Value
About This Home
This home is located at 409 Conlin Ave, Sycamore, IL 60178 and is currently priced at $383,000, approximately $141 per square foot. 409 Conlin Ave is a home located in DeKalb County with nearby schools including Sycamore High School, St Mary's Catholic School, and Cornerstone Christian Academy.
Ownership History
Date
Name
Owned For
Owner Type
Purchase Details
Closed on
May 11, 2023
Sold by
Vogel Robert R and Vogel Sherry L
Bought by
Sherry Lee Vogel Revocalbe Trust
Current Estimated Value
Purchase Details
Closed on
Feb 14, 2018
Sold by
Richard Graham
Bought by
Vogel Robert and Vogel Sherry
Home Financials for this Owner
Home Financials are based on the most recent Mortgage that was taken out on this home.
Original Mortgage
$169,750
Interest Rate
4.32%
Purchase Details
Closed on
Dec 15, 2017
Sold by
Graham Richard R and Graham Patricia A
Bought by
Vogel Robert R and Vogel Sherry L
Create a Home Valuation Report for This Property
The Home Valuation Report is an in-depth analysis detailing your home's value as well as a comparison with similar homes in the area
Home Values in the Area
Average Home Value in this Area
Purchase History
| Date | Buyer | Sale Price | Title Company |
|---|---|---|---|
| Sherry Lee Vogel Revocalbe Trust | -- | None Listed On Document | |
| Vogel Robert | -- | -- | |
| Vogel Robert R | $242,500 | None Available |
Source: Public Records
Mortgage History
| Date | Status | Borrower | Loan Amount |
|---|---|---|---|
| Previous Owner | Vogel Robert | $169,750 | |
| Previous Owner | Vogel Robert | -- |
Source: Public Records
Tax History
| Year | Tax Paid | Tax Assessment Tax Assessment Total Assessment is a certain percentage of the fair market value that is determined by local assessors to be the total taxable value of land and additions on the property. | Land | Improvement |
|---|---|---|---|---|
| 2022 | $9,118 | $103,497 | $15,635 | $87,862 |
| 2021 | $8,362 | $93,805 | $14,886 | $78,919 |
| 2020 | $8,189 | $90,879 | $14,422 | $76,457 |
| 2019 | $7,888 | $87,066 | $13,817 | $73,249 |
| 2018 | $5,530 | $55,820 | $13,352 | $42,468 |
| 2017 | $4,256 | $53,141 | $12,711 | $40,430 |
| 2016 | $3,909 | $49,944 | $11,946 | $37,998 |
| 2015 | -- | $50,577 | $11,218 | $39,359 |
| 2014 | -- | $48,679 | $10,797 | $37,882 |
| 2013 | -- | $50,445 | $11,189 | $39,256 |
Source: Public Records
Map
Nearby Homes
- 533 Bethany Rd
- Lot 13 Thornwood Dr
- Lot 31 Aster Rd
- 1839 Brower Place
- 206 Becker Place
- 215 Becker Place
- 216 Becker Place
- 1452 Bethany Rd
- Lot 4 W Prairie Dr
- 1208 Foxpointe Dr
- 1247 Daniel Ct
- 906 Somonauk St
- 1119 Yorkshire Dr N
- 962 Bailey Rd
- 1102 Nottingham Rd
- 1927 Parkside Dr
- 1032 Nottingham Rd
- 1024 Nottingham Rd
- 732 Park Ave
- 1008 Nottingham Rd
Your Personal Tour Guide
Ask me questions while you tour the home.