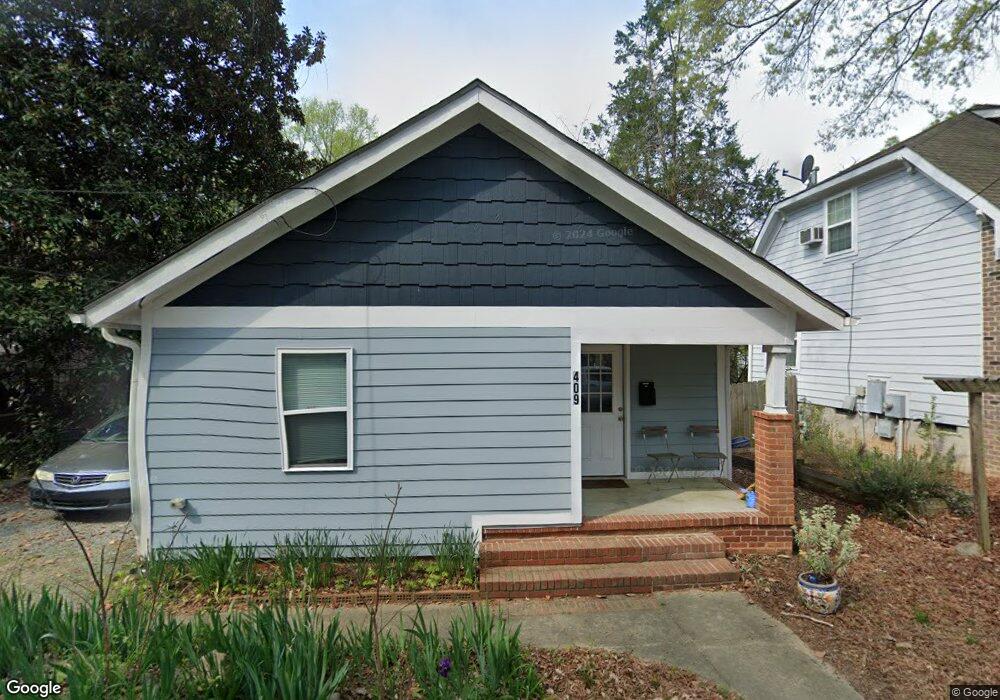
409 Cotton St Chapel Hill, NC 27516
Northside NeighborhoodEstimated Value: $341,000
2
Beds
1
Bath
672
Sq Ft
$507/Sq Ft
Est. Value
About This Home
This home is located at 409 Cotton St, Chapel Hill, NC 27516 and is currently priced at $341,000, approximately $507 per square foot. 409 Cotton St is a home located in Orange County with nearby schools including Northside Elementary School, Smith Middle School, and East Chapel Hill High School.
Ownership History
Date
Name
Owned For
Owner Type
Purchase Details
Closed on
Aug 24, 2017
Sold by
Self Help Ventures Fund
Bought by
Community Home Trust
Current Estimated Value
Home Financials for this Owner
Home Financials are based on the most recent Mortgage that was taken out on this home.
Original Mortgage
$125,000
Outstanding Balance
$104,499
Interest Rate
4.03%
Mortgage Type
New Conventional
Purchase Details
Closed on
May 13, 2016
Bought by
Self Help Ventures Fund
Purchase Details
Closed on
Apr 23, 2015
Sold by
Colvin John T
Bought by
409 Cotton Street Llc
Purchase Details
Closed on
Sep 27, 2012
Sold by
Haith Penny
Bought by
Colvin John T
Purchase Details
Closed on
Jun 11, 2008
Sold by
Miller Tammer H
Bought by
Piantadosi Michael S
Home Financials for this Owner
Home Financials are based on the most recent Mortgage that was taken out on this home.
Original Mortgage
$110,000
Interest Rate
6.02%
Mortgage Type
Construction
Create a Home Valuation Report for This Property
The Home Valuation Report is an in-depth analysis detailing your home's value as well as a comparison with similar homes in the area
Home Values in the Area
Average Home Value in this Area
Purchase History
| Date | Buyer | Sale Price | Title Company |
|---|---|---|---|
| Community Home Trust | -- | Investors Title | |
| Self Help Ventures Fund | $197,600 | -- | |
| 409 Cotton Street Llc | -- | None Available | |
| Colvin John T | $77,000 | None Available | |
| Piantadosi Michael S | $29,000 | None Available |
Source: Public Records
Mortgage History
| Date | Status | Borrower | Loan Amount |
|---|---|---|---|
| Open | Community Home Trust | $125,000 | |
| Previous Owner | Piantadosi Michael S | $110,000 |
Source: Public Records
Tax History Compared to Growth
Tax History
| Year | Tax Paid | Tax Assessment Tax Assessment Total Assessment is a certain percentage of the fair market value that is determined by local assessors to be the total taxable value of land and additions on the property. | Land | Improvement |
|---|---|---|---|---|
| 2025 | $1,925 | $257,700 | $125,000 | $132,700 |
| 2024 | $1,990 | $265,300 | $157,500 | $107,800 |
| 2023 | $1,942 | $265,300 | $157,500 | $107,800 |
| 2022 | $1,868 | $265,300 | $157,500 | $107,800 |
| 2021 | $1,846 | $265,300 | $157,500 | $107,800 |
| 2020 | $2,229 | $177,500 | $52,500 | $125,000 |
| 2018 | $2,172 | $177,500 | $52,500 | $125,000 |
| 2017 | $1,792 | $105,400 | $52,500 | $52,900 |
| 2016 | $1,792 | $101,380 | $43,722 | $57,658 |
| 2015 | $1,792 | $101,380 | $43,722 | $57,658 |
| 2014 | $1,749 | $101,380 | $43,722 | $57,658 |
Source: Public Records
Map
Nearby Homes
- 309 Mitchell Ln
- 316 Brooks St
- 503 Edwards Dr
- 140 W Franklin St Unit 429
- 140 W Franklin St Unit 703
- 601 W Rosemary St Unit 405
- 601 W Rosemary St Unit 801
- 135 North St
- 107 Mulberry St Unit B
- 620 Martin Luther King jr Blvd Unit 602
- 214 Spring Ln
- 103 Hargraves St Unit K
- 506 N Greensboro St Unit 35
- 213 E Franklin St Unit 400
- 269 Sweet Bay Place
- 301 Hillsborough St Unit A
- 107 Hillcrest Ave Unit C & D
- 500 Umstead Dr Unit 103
- 500 Umstead Dr Unit 304
- 702 N Greensboro St