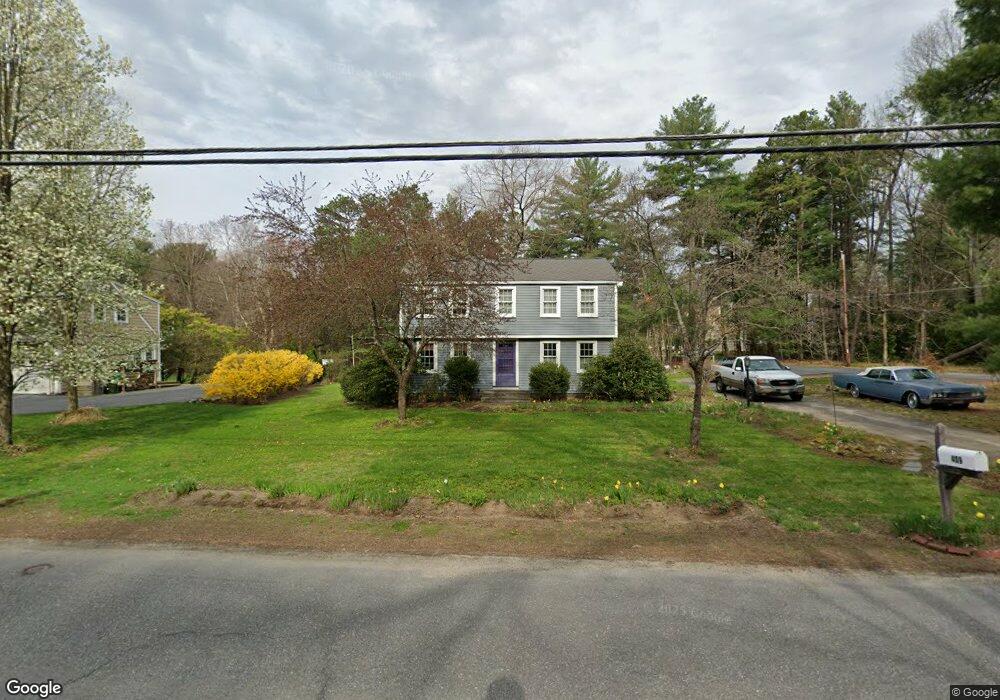
409 Dutton Rd Sudbury, MA 01776
Estimated Value: $793,000 - $934,000
4
Beds
2
Baths
1,568
Sq Ft
$549/Sq Ft
Est. Value
About This Home
This home is located at 409 Dutton Rd, Sudbury, MA 01776 and is currently estimated at $861,095, approximately $549 per square foot. 409 Dutton Rd is a home located in Middlesex County with nearby schools including Peter Noyes Elementary School, Ephraim Curtis Middle School, and Lincoln-Sudbury Regional High School.
Ownership History
Date
Name
Owned For
Owner Type
Purchase Details
Closed on
Jan 13, 2000
Sold by
Adamson Janet E
Bought by
Falvey Walter A and Falvey Jill W
Current Estimated Value
Home Financials for this Owner
Home Financials are based on the most recent Mortgage that was taken out on this home.
Original Mortgage
$266,050
Interest Rate
7.79%
Mortgage Type
Purchase Money Mortgage
Create a Home Valuation Report for This Property
The Home Valuation Report is an in-depth analysis detailing your home's value as well as a comparison with similar homes in the area
Home Values in the Area
Average Home Value in this Area
Purchase History
| Date | Buyer | Sale Price | Title Company |
|---|---|---|---|
| Falvey Walter A | $313,000 | -- |
Source: Public Records
Mortgage History
| Date | Status | Borrower | Loan Amount |
|---|---|---|---|
| Open | Falvey Walter A | $266,000 | |
| Closed | Falvey Walter A | $266,000 | |
| Closed | Falvey Walter A | $266,050 | |
| Previous Owner | Falvey Walter A | $25,000 |
Source: Public Records
Tax History Compared to Growth
Tax History
| Year | Tax Paid | Tax Assessment Tax Assessment Total Assessment is a certain percentage of the fair market value that is determined by local assessors to be the total taxable value of land and additions on the property. | Land | Improvement |
|---|---|---|---|---|
| 2025 | $10,102 | $690,000 | $392,600 | $297,400 |
| 2024 | $9,752 | $667,500 | $381,100 | $286,400 |
| 2023 | $9,240 | $585,900 | $346,400 | $239,500 |
| 2022 | $9,041 | $500,900 | $317,900 | $183,000 |
| 2021 | $8,861 | $470,600 | $317,900 | $152,700 |
| 2020 | $8,683 | $470,600 | $317,900 | $152,700 |
| 2019 | $8,428 | $470,600 | $317,900 | $152,700 |
| 2018 | $8,257 | $460,500 | $321,600 | $138,900 |
| 2017 | $7,949 | $448,100 | $310,500 | $137,600 |
| 2016 | $7,691 | $432,100 | $298,700 | $133,400 |
| 2015 | $7,309 | $415,300 | $284,600 | $130,700 |
| 2014 | $7,259 | $402,600 | $274,700 | $127,900 |
Source: Public Records
Map
Nearby Homes
- 21 Summer St
- 7 Saddle Ridge Rd
- 143 Peakham Rd
- 30 Rolling Ln
- 47 Fairbank Rd
- 12 Hickory Rd
- 54 Stone Rd
- 4 Elderberry Cir
- 0 Robbins Rd
- 36 Old Forge Ln
- 89 Bridle Path
- 123 Dutton Rd
- 12 Camperdown Ln
- 0 Boston Post Rd
- 24 Goodnow Rd
- 270 Old Lancaster Rd
- 54 Phillips Rd
- 7 Adams Rd
- 24 Woodland Rd
- 55 Widow Rites Ln