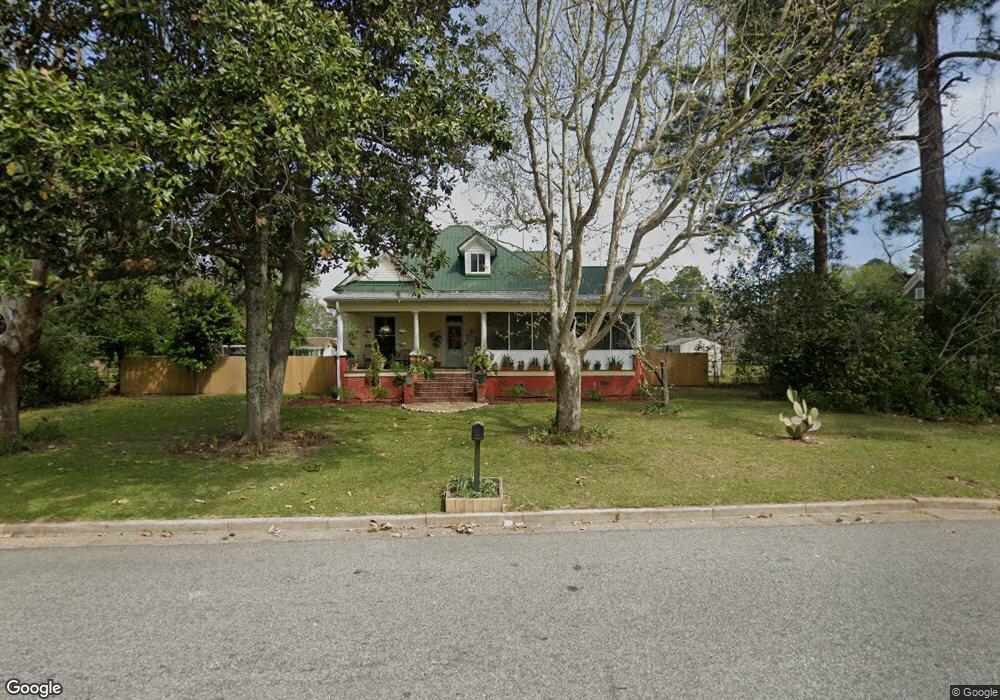
409 E 5th Ave Cordele, GA 31015
Estimated Value: $84,000 - $123,000
3
Beds
1
Bath
2,258
Sq Ft
$45/Sq Ft
Est. Value
About This Home
This home is located at 409 E 5th Ave, Cordele, GA 31015 and is currently estimated at $101,591, approximately $44 per square foot. 409 E 5th Ave is a home located in Crisp County with nearby schools including Crisp County Elementary School, Crisp County Primary School, and Crisp County Middle School.
Ownership History
Date
Name
Owned For
Owner Type
Purchase Details
Closed on
Mar 27, 2020
Sold by
Ross Danny L
Bought by
Dickerson William A and Dickerson Jackie J
Current Estimated Value
Home Financials for this Owner
Home Financials are based on the most recent Mortgage that was taken out on this home.
Original Mortgage
$40,000
Outstanding Balance
$18,374
Interest Rate
3.4%
Mortgage Type
New Conventional
Estimated Equity
$83,217
Purchase Details
Closed on
Aug 23, 2000
Sold by
Sinnott Michael +
Bought by
Ross Danny L and Ross Carol
Purchase Details
Closed on
Mar 18, 1994
Sold by
Parham Parham E and Parham Danny
Bought by
Sinnott Michael +
Purchase Details
Closed on
Sep 15, 1982
Sold by
Pierce Marjorie C
Bought by
Parham Parham E and Parham Danny
Purchase Details
Closed on
Feb 9, 1982
Bought by
Pierce Marjorie C
Create a Home Valuation Report for This Property
The Home Valuation Report is an in-depth analysis detailing your home's value as well as a comparison with similar homes in the area
Purchase History
| Date | Buyer | Sale Price | Title Company |
|---|---|---|---|
| Dickerson William A | $40,000 | -- | |
| Ross Danny L | $21,900 | -- | |
| Sinnott Michael + | $25,000 | -- | |
| Parham Parham E | $13,000 | -- | |
| Pierce Marjorie C | -- | -- |
Source: Public Records
Mortgage History
| Date | Status | Borrower | Loan Amount |
|---|---|---|---|
| Open | Dickerson William A | $40,000 |
Source: Public Records
Tax History
| Year | Tax Paid | Tax Assessment Tax Assessment Total Assessment is a certain percentage of the fair market value that is determined by local assessors to be the total taxable value of land and additions on the property. | Land | Improvement |
|---|---|---|---|---|
| 2025 | $1,161 | $35,328 | $2,000 | $33,328 |
| 2024 | $1,091 | $31,838 | $2,000 | $29,838 |
| 2023 | $1,077 | $30,128 | $2,000 | $28,128 |
| 2022 | $697 | $28,383 | $2,000 | $26,383 |
| 2021 | $683 | $26,638 | $2,000 | $24,638 |
| 2020 | $750 | $26,638 | $2,000 | $24,638 |
| 2019 | $756 | $26,638 | $2,000 | $24,638 |
| 2018 | $785 | $26,640 | $3,000 | $23,640 |
| 2017 | $1,082 | $26,640 | $3,000 | $23,640 |
| 2016 | $788 | $26,640 | $3,000 | $23,640 |
| 2015 | -- | $26,640 | $3,000 | $23,640 |
| 2014 | -- | $26,640 | $3,000 | $23,640 |
| 2013 | -- | $26,639 | $3,000 | $23,639 |
Source: Public Records
Map
Nearby Homes
Your Personal Tour Guide
Ask me questions while you tour the home.